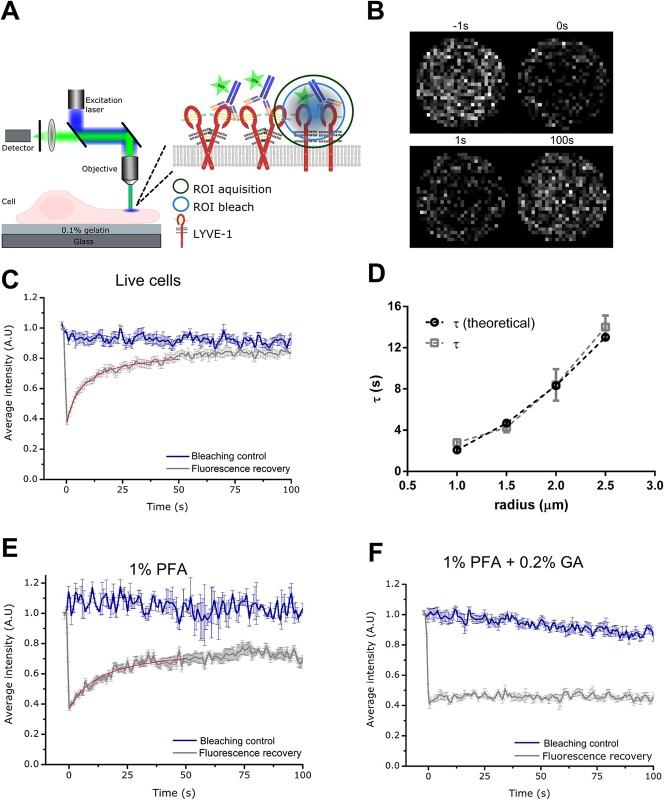
Fig. 3.
FRAP analysis of LYVE-1 in HDLECs labelled with fluorescent (Oregon Green® 488) primary antibody mAb. (A) Schematic diagram of FRAP experiments. Confocal scanning microscope with excitation laser (blue), objective lens, collected fluorescence (green), fluorescence detector and sample (lymphatic cell with labelled LYVE-1 in the plasma membrane grown on a gelatin layer on top of the microscope cover glass), inset: first fluorescent labels are photobleached in a region-of-interest (ROI bleach, blue circle, focus on apical plasma membrane) by intense laser irradiation and then mobility of the labelled molecules measured as recovery of fluorescence signal due to influx of un-bleached molecules (ROI acquisition, green circle) using low laser irradiation. (B) Confocal images of LYVE-1 in living cells within the ROI at different time points with respect to the photobleaching (as labelled) depicting the recovery of fluorescence signal after the photobleaching. (C) Fluorescence recovery of LYVE-1 as a function of time in live cells (grey, for blue and red curves see explanation to panels E and F). (D) Fluorescence recovery time τ of LYVE-1 in live cells determined for different radii of the ROI (grey), depicting a quadratic dependence as expected for diffusion (theoretical – see Materials and Methods, black). (E,F) Fluorescence recovery of LYVE-1 as a function of time in cells fixed with (E) 1%PFA and (F) 1%PFA+0.2% GA. Grey curve original ‘fluorescence recovery’ data as average over at least 14 measurements (live cells) and five measurements (fixed cells) at different sample positions and with error bars depicting the standard deviation of the mean, red curve fit to the data (see Materials and Methods), and blue curve ‘bleaching control’ data taken without photobleaching pulse depicting photobleaching during observation.

