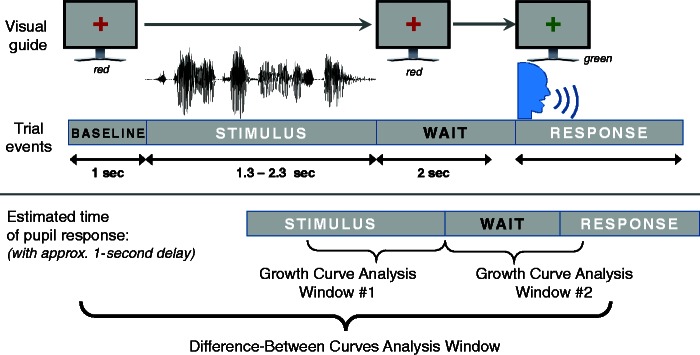
Figure 1.
Timeline of events during experimental trials. The monitor seen by the participant contained a colored fixation cross that changed to green to elicit a verbal response. The trial events show the timeline of the auditory stimuli, while the timeline of the pupillary responses are estimated to arise roughly 1 s after their corresponding auditory events. Windows for growth curve analysis are indicated by two small brackets that include the stimulus, and the wait time, respectively. The window for difference-between curves analysis is represented by the large bracket that included the entire stimulus, wait period, and part of the verbal response.

