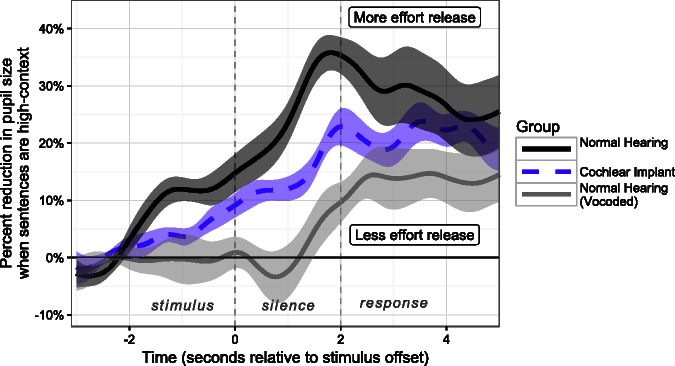
Figure 3.
Differences between curves illustrated in Figure 2, expressed as percentage reduction of pupil size compared with low-context condition. Greater magnitudes indicate more benefit from context as indicated by greater reduction in pupillary response. The left dashed line (Time 0) shows the offset of the sentence while the right dashed line (Time 2 s) shows the timing of the response prompt.

