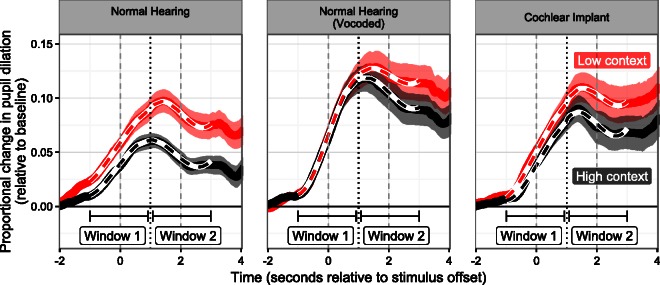
Figure 4.
Validation of the polynomial growth curve model used to estimate pupillometric data displayed in Figure 2. Model fits (dashed lines) are overlaid on ribbons that reflect ±1 standard error of the mean of the group data. Separate models were used to estimate Window 1 (reflecting the perception phase of the trials) and Window 2 (reflecting the planning and response phase of the trials).

