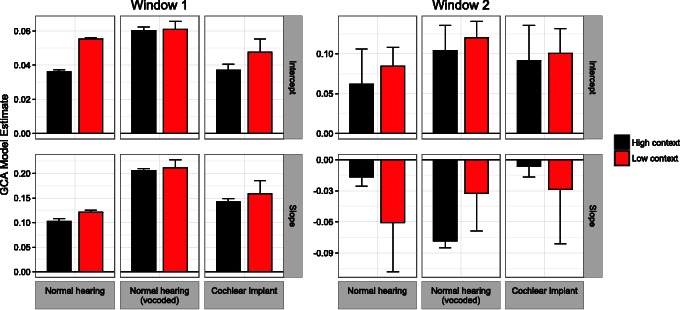
Figure 5.
Illustration of the intercept slope parameter of the polynomial growth curve models displayed in Figure 4. Intercept reflects overall level while slope reflects the rate of pupillary growth during the indicated time window. For Window 2, negative slope corresponds to the rate at which pupil size returned to baseline.

