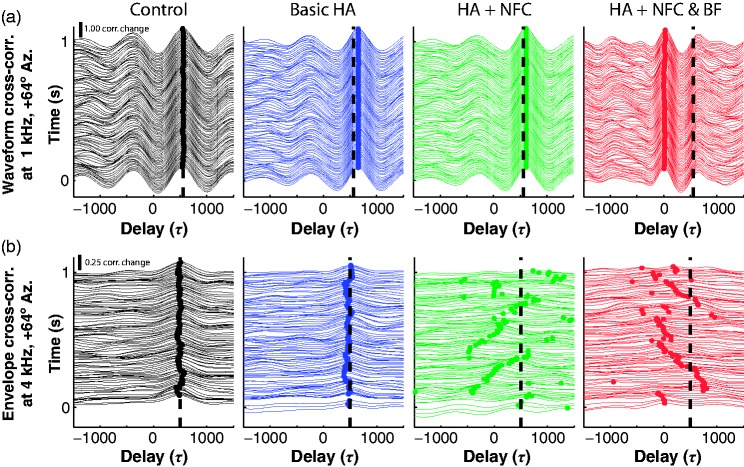
Figure 3.
Calculation of time-varying ITD. (a) Normalized cross-correlation of left and right signal waveform at 1 kHz, computed according to Equation (2), for a 50-ms window running from the beginning to the end of a 10-Hz sinusoidally amplitude modulated noise presented from the +64° loudspeaker. Within each panel, the bold point along each trace indicates the estimated ITD for that temporal window, taken as the maximum value of the cross-correlation function (see text). In all panels, the vertical dashed line indicates the time-averaged ITD estimated in the Control condition (black). Scale bar indicates a change in correlation of 1.0. (b) As in (a), but for the signal envelope at 4 kHz. Scale bar indicates a change in correlation of 0.25. Note. ITD = interaural time difference.

