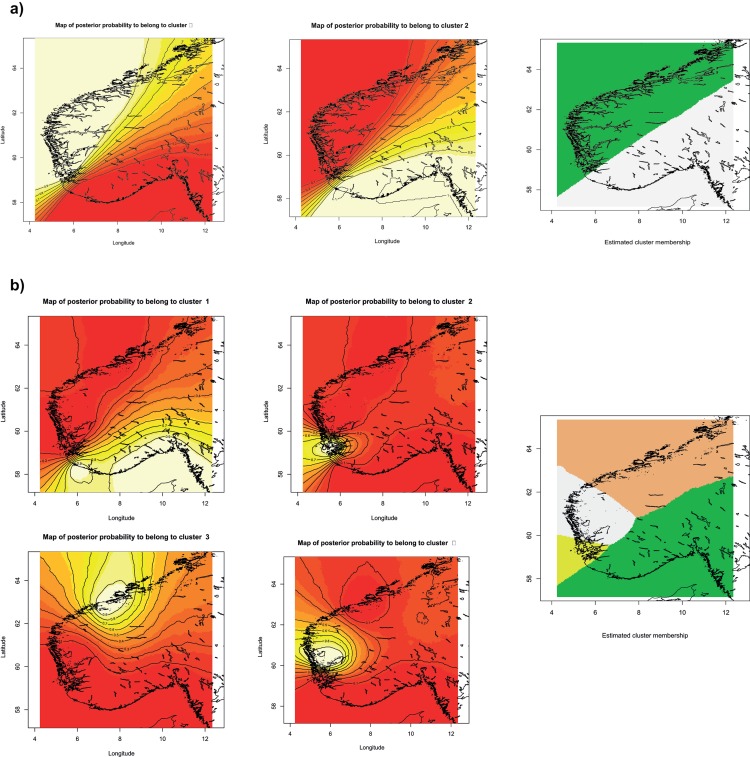
Fig 2.
Maps of posterior probabilities of corkwing wrasse individual membership defined by GENELAND under a) uncorrelated (K = 2) and b) correlated (K = 4) alleles model. Plots representing assignment of pixels to each cluster (highest probability in light yellow and zero probability in red) and map of estimated posterior probability of population membership are presented for each model.

