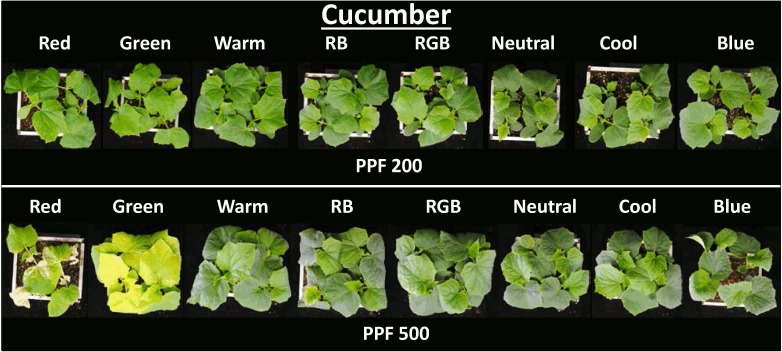
Fig 3. Overhead view of cucumber plants at harvest.
Includes all eight LED treatments at both light intensities arranged from low to high BL fraction. There were four plants per treatment and three replicates per study. Note the difference in coloration with the green and red treatments at the 500 PPF level (DLI = 29 mol m-2 d-1).

