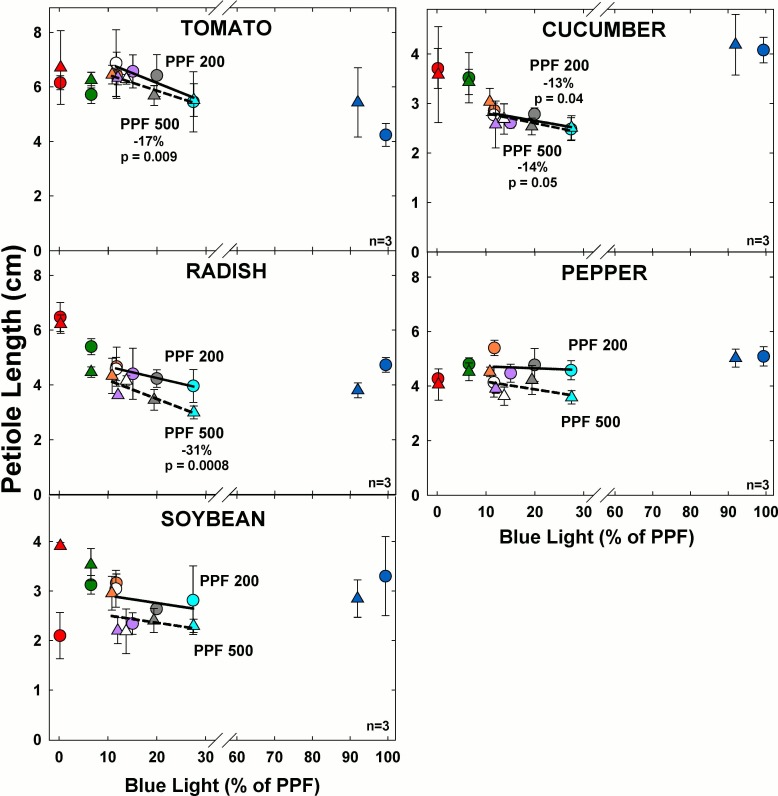
Fig 12. The effect of percent blue light on petiole length for seven species under two PPFs.
Note scale break for percent BL between 30 and 60. Each data point shows the mean and standard deviation of three replicate studies for each species (n = 3). Some error bars are smaller than the symbol size. See Fig 1 for symbol color and shape legend. To minimize confounding spectral effects the regression line includes only the four treatments with comparable green and red wavelengths for each PPF. When significant, p-values and percent change are shown.

