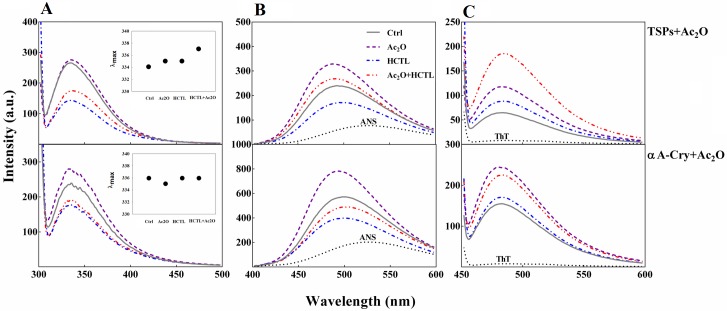
Fig 6. Fluorescence analysis of lens proteins upon modification with Ac2O and HCTL.
(A) Trp fluorescence assessment of lens proteins. Protein samples including native and acetylated proteins incubated without and with HCTL diluted to 0.15 mg mL-1 in buffer C. The excitation wavelength was 295 nm and emission spectra were collected between 300 and 500 nm. The excitation/emission slit widths were 5/10 nm for TSPs and 10/10 nm for αA-Cry samples. The inset figures display λmax for control (334 nm), acetylated (335 nm), homocysteinylated (335 nm) and doubled modified (337 nm) TSPs. Also, this value for the control sample, homocysteinylated and doubled modified αA-Cry is 336 nm and for acetylated αA-Cry is 335 nm. (B) ANS fluorescence analysis of the lens proteins. Protein samples (0.15 mg mL-1 diluted in buffer C) were incubated with ANS (100 μM) for 30 min. The ANS fluorescence emission spectra were collected between 400 and 600 nm, with an excitation wavelength of 365 nm. The excitation/emission slit widths were set at 10/10 nm for TSPs and at 10/20 for αA-Cry. (C) The fluorescence experiment was performed with incubation of the protein samples (0.15 mg mL -1 diluted in buffer C) in the presence of ThT (20 μM) for 10 min. The protein samples were excited at 440 nm and the slit widths for excitation/emission were fixed at 10/10 nm.

