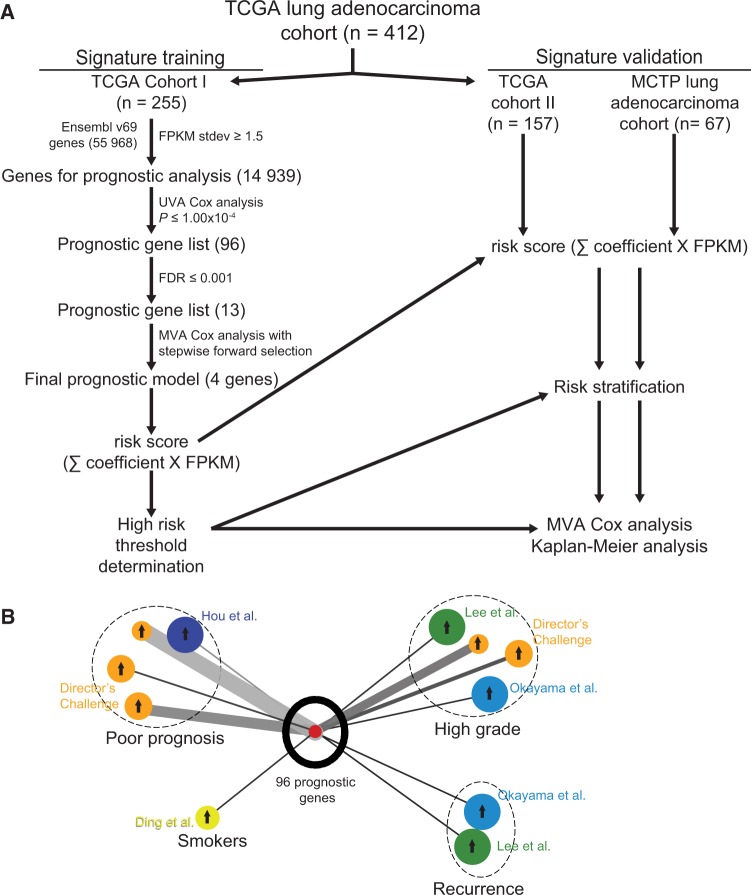
Figure 1.
Identification of prognostic gene signature. A) RNA-seq prognostic analysis and signature generation pipeline. The Cancer Genoma Atlas (TCGA) lung adenocarcinoma cohort was divided chronologically into TCGA cohort I (n = 255) and TCGA cohort II (n = 157). In TCGA cohort I, we filtered the 55 968 Ensembl v69 genes by standard deviation (stdev) greater than or equal to 1.5 fragments per kilobase of transcript per million reads (FPKM). The resulting 14 939 genes were analyzed individually for prognostic significance by univariate Cox proportional hazards models, and 96 genes were statistically significant at the level of P ≤ 1.00x10⁻⁴. We further narrowed this gene list to 13 genes with false discovery rates (FDRs) ≤ 0.001 and used multivariable Cox proportional hazards stepwise regression with forward selection to build a prognostic model that included four genes: RHOV, CD109, LINC00941, and FRRS1. This model was used to calculate risk scores for all TCGA cohort I patients by summing the product of model coefficient and FPKM for each gene, and a high risk threshold was chosen. This risk score calculation and high risk threshold was then applied to TCGA cohort II and Michigan Center for Translational Pathology cohort, and prognostic significance was analyzed with multivariable Cox proportional hazards models and Kaplan-Meier analysis. B) Oncomine lung adenocarcinoma signature concept analysis of top 96 prognostic genes. Results were exported as the nodes and edges of a concept association network and visualized using Cytoscape v3.1.1. Oncomine lung adenocarcinoma signatures are color-coded for the cohort in which they were generated, as labeled, and grouped (dashed circles) by the concept of the signature (Poor prognosis, Smokers, High grade, or Recurrence). The size of each signature circle is proportional to the number of genes in the signature, including for the top 96 prognostic genes in our study. Arrows in the center of each signature circle indicate positive (up arrow) or negative (down arrow) correlation with the top 96 prognostic genes, and the width of the connecting line indicates the strength of correlation. FDR = Benjamini-Hochberg false discovery rate; FPKM = fragments per kilobase of transcript per million reads; MCTP = Michigan Center for Translational Pathology; MVA = multivariable; Stdev = standard deviation; TCGA = The Cancer Genome Atlas; UVA = univariate.

