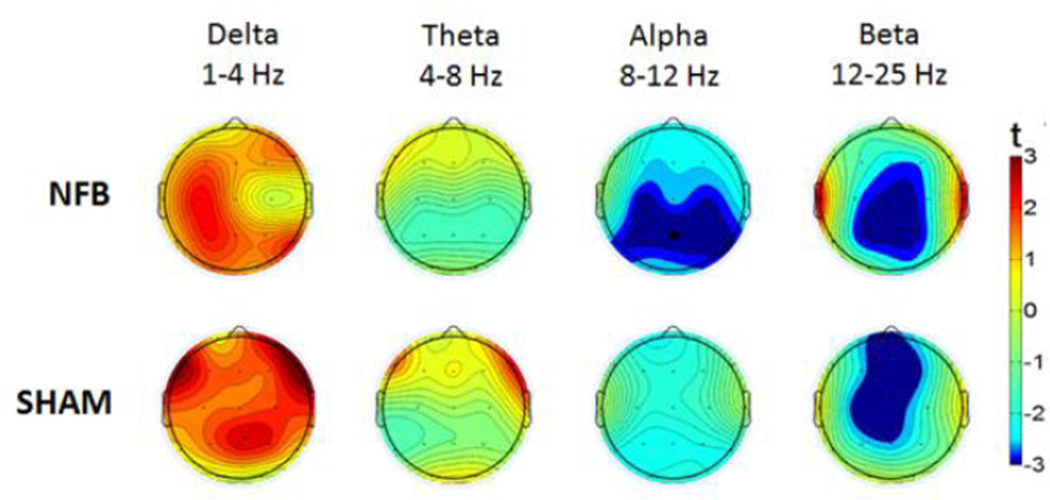
Fig 2. Topographic plots of mean EEG amplitude change during feedback (relative to rest).
Upper and lower panels represent NFB and SHAM groups, with successive EEG bandwidths featuring from left to right. Dark red and dark blue colors indicate statistically significant positive and negative changes (P < 0.05), respectively.

