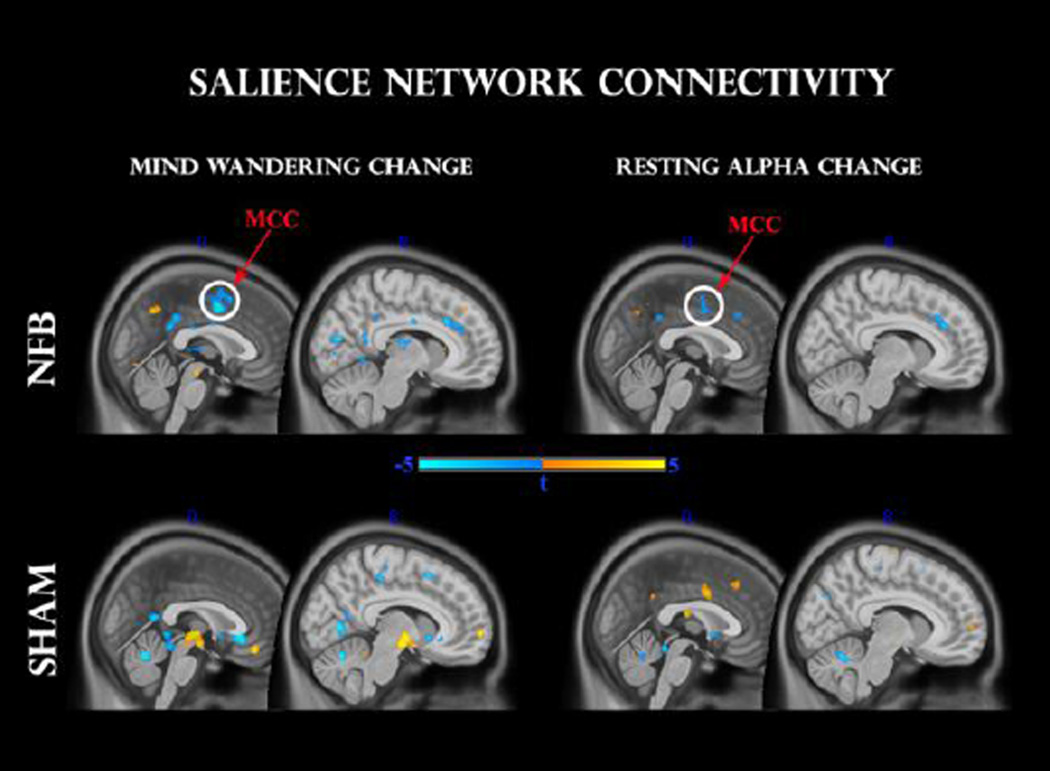
Fig 5.
Regression analysis between pre-to-post changes in salience network functional connectivity and mind-wandering change (left panel), as well as resting alpha change (right panel). Upper and lower panels indicate NFB and SHAM groups, respectively. Clusters surviving the family-wise error (FWE < 0.05) correction are circled in white. MCC: mid-cingulate cortex.

