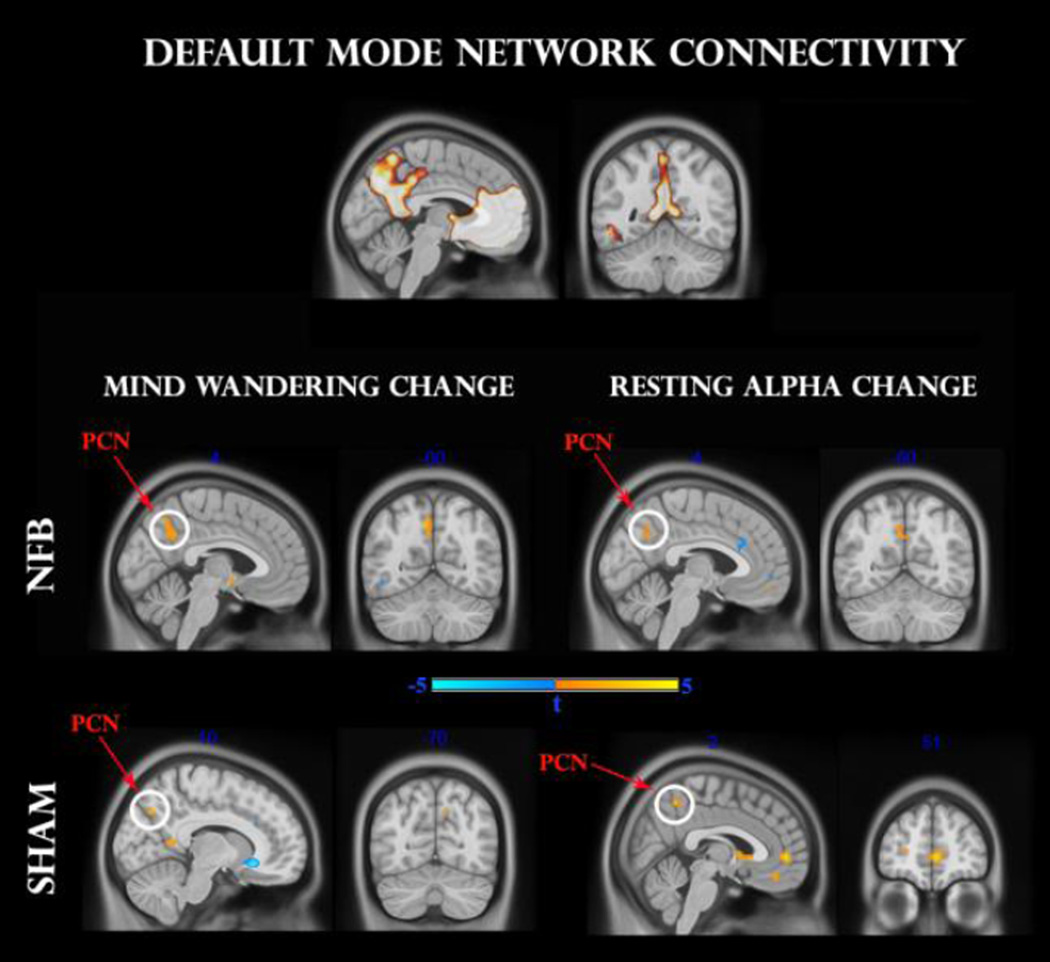
Fig 6.
Regression analysis between pre-to-post changes in default-mode network (DMN) functional connectivity and mind-wandering change (left panel), as well as resting alpha change (right panel). The upper panel designates the DMN mask used for analysis. Middle and lower panels indicate NFB and SHAM groups, respectively. Clusters surviving the family-wise error (FWE < 0.05) correction are circled in white. Pcn: precuneus; mPFC: medial prefrontal cortex.

