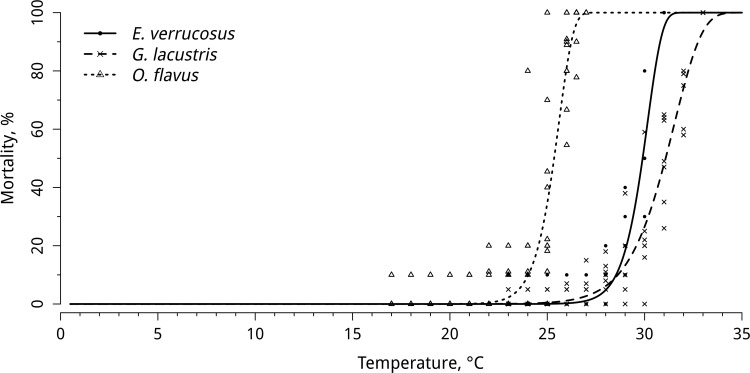
Fig 2. Mortality of E. verrucosus (n = 7), O. flavus (n = 11) and G. lacustris (n = 7) during exposure to a gradual temperature increase/decrease.
The figure includes data on gradually increasing hypothermia and hyperthermia experiments. Additional information presented in S2 Table.

