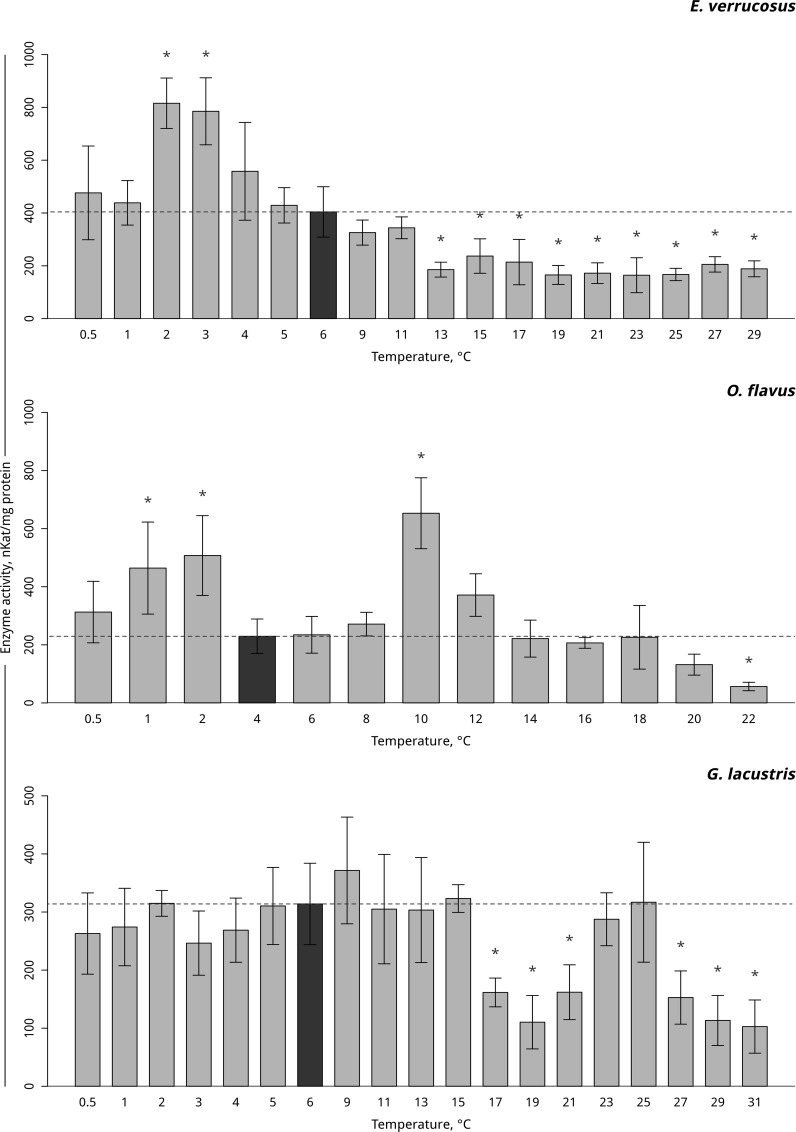
Fig 8. Lactate dehydrogenase activity (in nKat/ mg protein) in amphipods species during exposure to gradual temperature changes.
The figure includes data from hypothermia and hyperthermia experiments. *Indicates significant difference (p<0.05) from the control (O. flavus: 4°C; for E. verrucosus: 6°C and G. lacustris: 6°C). The dark grey columns and dotted line indicate the control level. Number of replicates: O. flavus (ncontrol = 6, nexp. = 4–5); E. verrucosus (ncontrol = 13, nexp. = 6–9) and G. lacustris (ncontrol = 10, nexp. = 7–9). Additional information presented in S8 Table.

