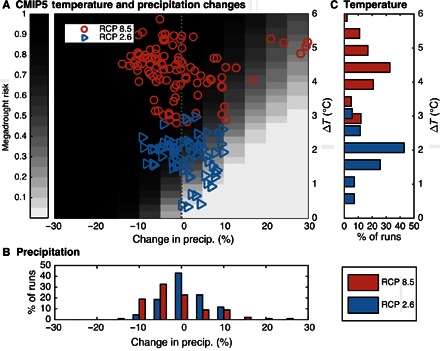
Fig. 2. Megadrought risk expressed as a function of both mean precipitation and temperature for the American Southwest compared with projected changes in temperature and precipitation.

(A) Megadrought risk expressed as a function of both mean precipitation and temperature for the American Southwest (shading) compared with projected changes in temperature and precipitation (symbols) for two scenarios: RCP 2.6 (low emissions, blue triangles) and RCP 8.5 (high emissions, red circles). CMIP5 estimates of change are expressed as the difference between the historical reference period (1951–2000) and the midcentury average (2051–2080). The megadrought risk surface (shading) is the average of all 2D PDFs calculated at each grid point in the Southwest for each combination of temperature and precipitation change. JJA PDSI is used as the reference normalized drought indicator time series [z′(t)]. The vertical dashed line marks no change in precipitation. (B) Marginal distribution of precipitation change in CMIP5 models, binned at 5% intervals from −30 to +30% of historical climatology. (C) Marginal distribution of temperature changes, binned at 0.5°C intervals from zero to six.
