
Fig. 2. Migration speeds.
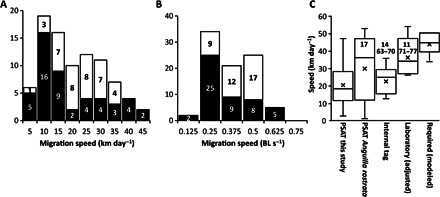
(A) Frequency distribution of observed migration speeds of tagged eels. Migration speed was calculated from the distance taken over either the fully reconstructed migration path (n = 38) or the distance between release and pop-up (n = 49) when full reconstruction was not possible. Labels show the midpoints of the bins. (B) As for (A), but expressed in body lengths per second. The migration speeds of eels that reached the ocean are shown in white, whereas the speeds of those eels that did not reach the ocean are shown in black. (C) Comparison of eel travel speeds reported here and in the literature (citations are given within or above the data). Box plots show the median value as a horizontal line and the mean as a cross. To enable comparison, swimming speeds observed in swim tunnel studies have been adjusted downward by 5 km day−1 to account for the average current speed that eels are likely to experience in the northeast Atlantic (45).