
Fig. 3. Vertical migration behavior.
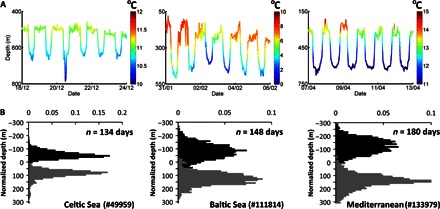
(A) Example vertical migrations of individuals measured over a 6-day period. Charts show an individual (#49559) released from Ireland that was migrating in the mid-Atlantic Ocean, an individual released from Sweden (#118814) that was migrating in the Norwegian Sea, and an individual from southern France (#133979) that was migrating in the eastern Atlantic Ocean. Depth and temperature data collected at between 15- and 30-min intervals are shown interpolated to a 1-min resolution. The color scales show temperature in degrees Celsius and vary between data sets in relation to eel location. (B) Vertical displacement histograms for the oceanic portion of migration for the same eels shown in (A). Because the average depth of eels increases considerably over the course of their migration, the depth measurements for each day were normalized to the average daily depth and separated into day/night (black/gray) periods. Negative values represent depths shallower than the mean.