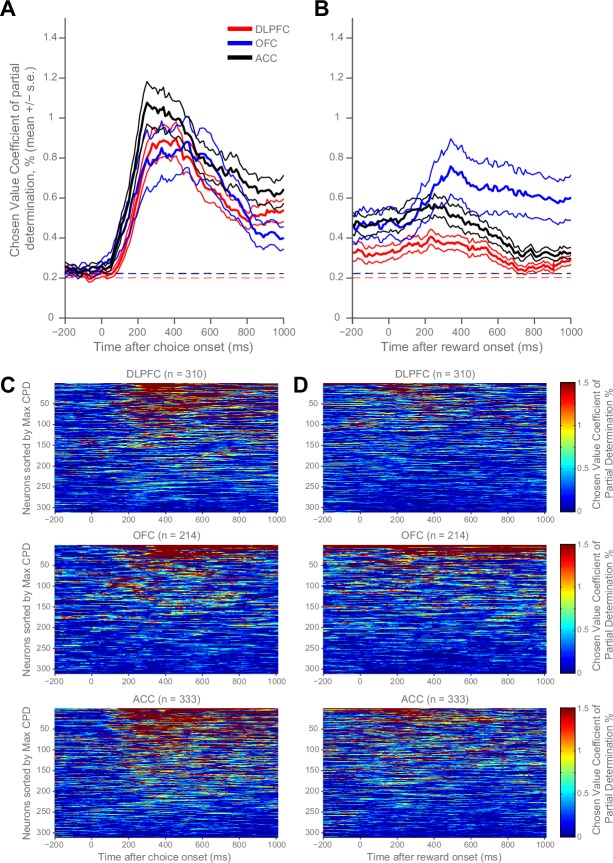
Figure 1. Homogeneity and heterogeneity of chosen value correlates.
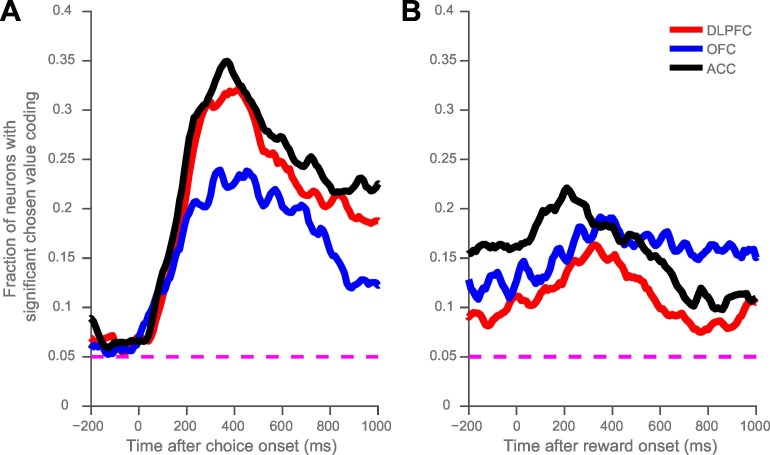
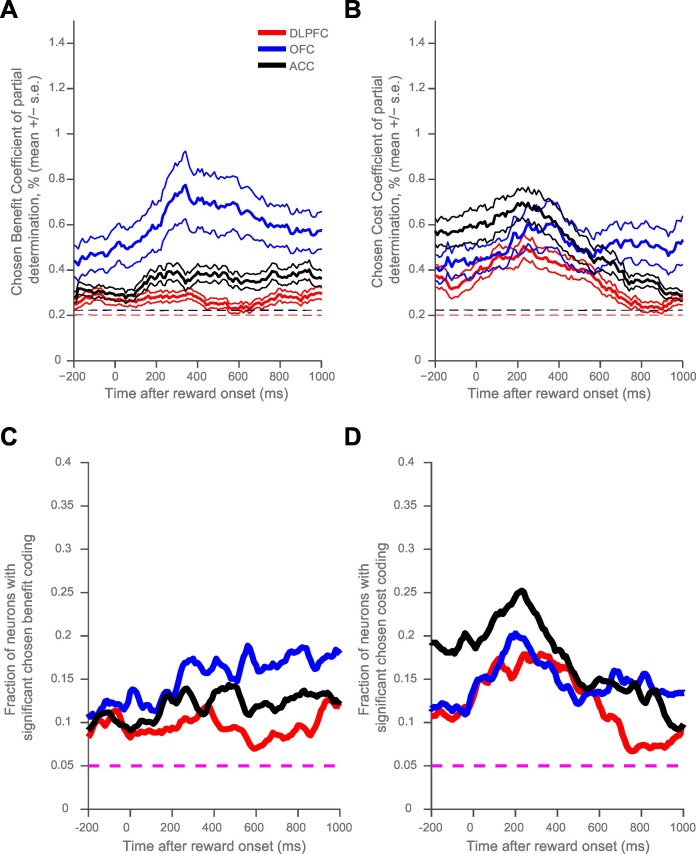
(A) At decision time, chosen value correlates appeared homogenous across regions in their expression. The coefficient of partial determination (CPD) for chosen value averaged across populations of DLPFC (n = 310), OFC (n = 214) and ACC (n = 333) neurons (lines denote mean ± SE for each region). CPD was calculated by regressing chosen value onto firing rate during the choice period of a cost-benefit decision making task (see Materials and methods). Chosen value correlates were not significantly different between any brain region (permutation tests; DLPFC v OFC, no cluster survived thresholding, DLPFC v ACC, p=0.2706, OFC v ACC, no cluster survived thresholding; see Materials and methods). Dashed lines mark the null hypothesis level for CPD in each cortical area (see Materials and methods). (B) Population averages when chosen value was regressed onto firing rate during reward delivery. OFC showed stronger chosen value correlates following reward onset than ACC and DLPFC (permutation tests; OFC v DLPFC, p=0.0010, OFC v ACC, p=0.0028; see Materials and methods). (C and D) Within each region, chosen value correlates were heterogeneous across neurons. Chosen value correlates of the individual neurons contributing to the population averages in A and B respectively. Within each matrix: each row is a neuron (sorted by maximum CPD within the corresponding epoch and area), each column is a 10 ms time bin. Hence, neurons are sorted in a different order in C and D. Chosen value coding at reward delivery was weaker than at choice. Figure 1—figure supplement 1 shows the fraction of neurons with reliable coding of chosen value at choice and at the outcome. Figure 1—figure supplement 2 shows that OFC codes chosen value, as opposed to chosen benefit alone, at the time of reward delivery.


