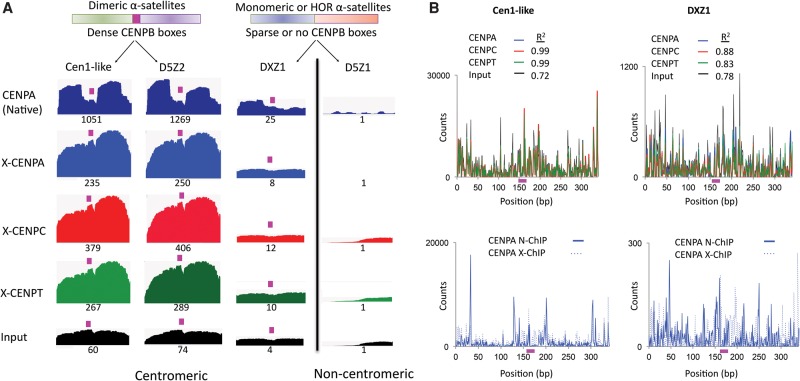
Figure 5.
CENPT and CENPC bridge the gap between adjacent CENPA nucleosomes over the CENPB box on young α-satellite dimers. (A) Mapping of X-ChIP merged pairs to previously characterized α-satellite arrays (Hayden et al. 2013; Henikoff et al. 2015). The profiles display normalized counts as described in Methods, in which entire fragments are “stacked,” and for each base-pair position the total number of counts is measured on the y-axis. A single α-satellite dimer from each array is shown. The CENPB box region is indicated by the magenta box. Cen1-like and D5Z2 arrays contain CENPB boxes in every α-satellite dimer (dense) (Henikoff et al. 2015). The DXZ1 tandem array, which is a 12-copy HOR, contains CENPB boxes only in a subset of dimeric units of the array (sparse), and a single CENPB box-containing dimer, which is embedded in α-satellite units that lack a CENPB box, is shown. The D5Z1 array does not contain CENPB boxes. The relative scale is the area of the indicated profile divided by the area of the D5Z1 profile, setting the D5Z1 value to 1, in which the numbers reflect the product of the total sequence abundance and enrichment. For example, Cen1-like is 60-fold enriched in the X-ChIP input, reflecting higher sequence abundance, and 235-fold enriched in CENPA ChIP, which implies that ChIP enrichment per copy is 235/60 or approximately fourfold. Biological replicates using different CENPT antibodies gave nearly identical patterns and relative scale values (Supplemental Fig. S2). (B) Fragment ends from native and X-ChIP data sets were mapped to the Cen1-like consensus and DXZ1 sequences. The CENPB box region is indicated by the magenta box. The top panel shows ends from CENPA, CENPC, CENPT X-ChIP, and input. The bottom panel compares ends of CENPA reads in N-ChIP (solid line) and X-ChIP (dotted line).

