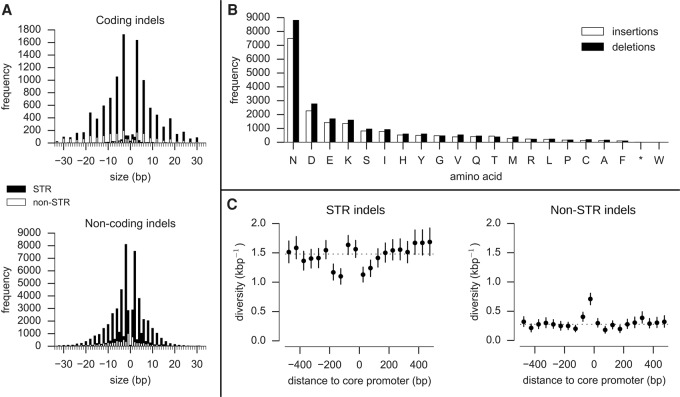
Figure 1.
Properties of indels. (A) Indel size distribution (size > 0 are insertions, size < 0 are deletions). Solid black bars represent the frequency of indels that are expansions or contractions of short tandem repeats (STR); solid white bars represent the frequency of non-STR indels. Most coding indels are size multiples of 3, preserving the reading frame. Most noncoding indels are size multiples of 2, reflecting the abundance of poly(AT) repeats in noncoding regions. (B) Amino acids inserted and deleted (relative to the 3D7 reference genome). (C) Indel diversity in intergenic regions relative to the position of core promoters predicted by Brick et al. (2008). Each point represents the mean indel diversity in a 50-bp window at a given distance from the center of a core promoter. Vertical bars represent the 95% confidence interval from 1000 bootstraps. The dashed line is at the mean intergenic diversity for the given indel class (STR/non-STR).

