Figure 3.
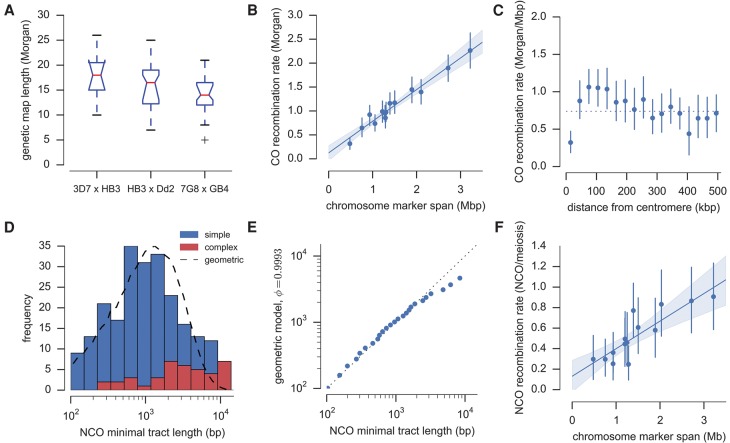
Crossover (CO) and non-crossover (NCO) recombination parameters. (A) Genetic map length by cross. For each cross, the red line shows the median map length averaged over progeny; boxes extend from lower to upper quartiles. (B) Map length by chromosome. Each point shows the mean map length for a single chromosome averaged over progeny, with an error bar showing the 95% confidence interval from 1000 bootstraps. The line shows a fitted linear regression model with shading showing the 95% bootstrap confidence interval. (C) CO recombination rate relative to centromere position as given by the genome annotation. Error bars show the 95% confidence interval from 1000 bootstraps. (D) NCO tract length distribution. The dashed line shows the distribution of minimal tract lengths that would be observed with the available markers if NCO tract lengths follow a geometric distribution with parameter φ= 0.9993. (E) Quantile-quantile plot of actual NCO minimal tract lengths versus the expected distribution of minimal tract lengths that would be observed with the given markers if NCO tract length is modeled as a geometric distribution with parameter φ = 0.9993. The data fit the model well except for an excess of tracts with minimal length greater than ∼3 kb. (F) NCO frequency by chromosome, adjusted for incomplete discovery of NCO events. Error bars and linear regression as in B.

