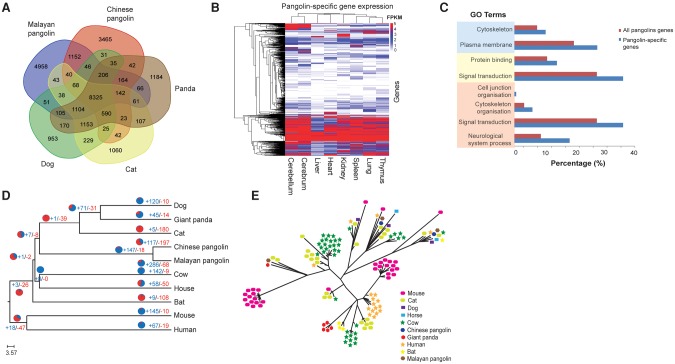
Figure 3.
Comparative analysis between pangolins and mammals. (A) Venn diagram showing the unique and shared gene families among pangolins and their closest relatives (cat, dog, and giant panda). (B) Heat map showing the expression level of pangolin-specific genes across different pangolin organs, represented by FPKM values. Any FPKM values >5 were set to 5 in the heat map for visualization purposes. Only genes expressed (FPKM ≥ 0.3) in at least one organ were shown. (C) GO enrichment analysis of 1152 pangolin-specific genes. Significantly enriched GO terms are shown for the categories of cellular compartment (blue), molecular function (yellow), and biological process (light orange). (D) Phylogenetic tree and gene family expansion and contraction. Expanded gene families are indicated in blue, whereas contracted gene families are indicated in red. The proportion of expanded and contracted gene families is also shown in pie charts. (E) Phylogenetic tree showing significant contraction of the interferon gene family in pangolins.

