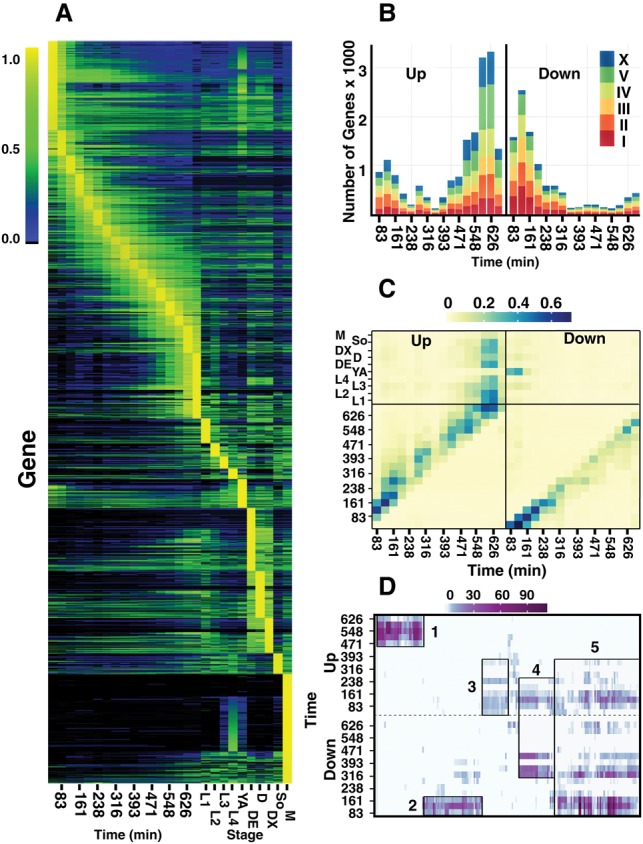
Figure 1.

Gene expression dynamics across all stages. (A) Normalized expression across embryogenesis and post-embryonic time points clustered by the stage of maximal expression (see Methods for details). Normalized expression is colored from none (black), to low (blue), to medium (green), and to maximal (yellow) with the scale provided on the left running from 0% to 100% of maximal expression per gene. Only genes (17,401) with at least one stage with expression >0.07 dcpm (depth of coverage per base per million reads) are shown. Embryonic stages on the left half of the plot are given in minutes, post-two-cell embryo. Post-embryonic stages include the four larval stages (L1–L4), young adult (YA), dauer entry (DE), dauer (D), dauer exit (DX), adult soma (SO), and L4 stage males (M). (B) Genes up-regulated (left) and down-regulated (right) in one stage relative to the previous time point are shown for each time point in embryogenesis. Gene counts for Chromosomes I, II, III, IV, V, and X are colored red, dark orange, light orange, yellow, green, and blue, respectively. (C) The proportion of genes overlapping between maximal expression clusters (y-axis) and those genes called as up-regulated (left) or down-regulated (right; x-axis) is shown for each embryonic stage. The proportion is colored from light yellow (0) to dark blue (0.65). (D) GO term enrichments for each up-regulated (top) and down-regulated (bottom) set of genes for each time point are clustered and then plotted against the embryonic time points. The significance of the enrichment at a particular time point (negative log of the P-value) is given from zero (white) to dark purple (P = 10−110). Five larger clusters of GO terms are highlighted in rectangles. For example, the fifth cluster has a down, up, down pattern.
