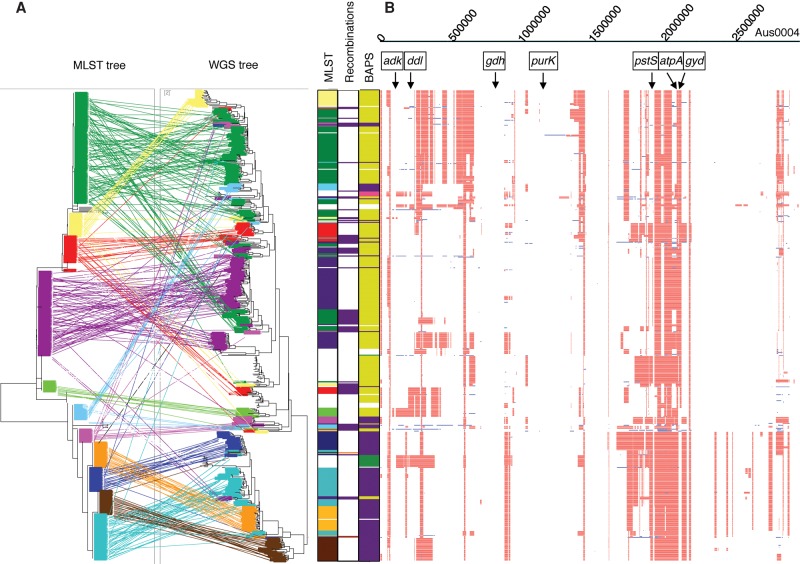
Figure 1.
Concordance between MLST and WGS data. (A, left) Tanglegram linking isolates in phylogenetic trees based on WGS and concatenated MLST loci. A different color is used to represent each ST present in more than one position in the WGS tree. Bars to the right show the STs indicated on the tree, the genetic basis for discrepancies between MLST and WGS (recombination = purple; point mutation = orange), and BAPS groups (BAPS 2-1 = purple, BAPS 2-3 = pink, BAPS 3-1 = green, BAPS 3-3 = yellow, unknown = white), with the positions on these bars relating to the position of the isolate on the WGS tree. (B) Recombination across the genome. Red indicates a recombination event found in more than one isolate; blue, a recombination event unique to that isolate. MLST genes and reference sequence are indicated at the top.

