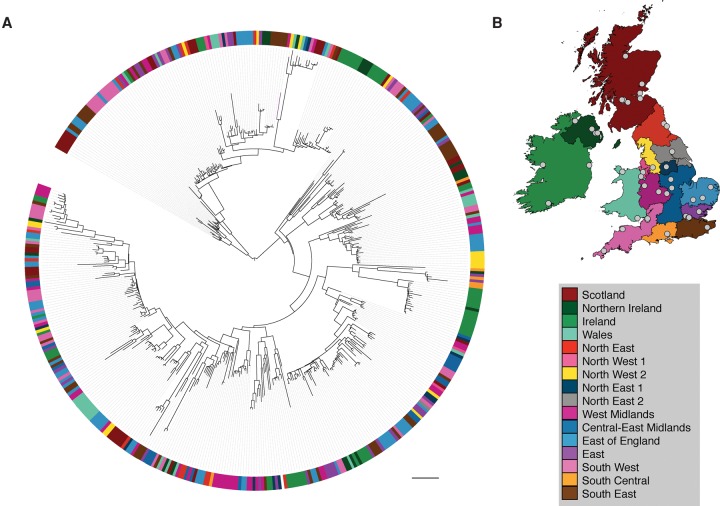
Figure 3.
Geographic distribution of E. faecium lineages across the UK&I. (A) Maximum likelihood tree based on SNPs in the core genome for national isolates belonging to the clonal expansion of Clade A. Colors shown in the colored circle represent the referral network or country where the isolates were cultured. Scale bar, 90 SNPs. (B) Map of regions and referral networks described previously (Donker et al. 2012). Centers that submitted samples to the BSAC between 2001 and 2011 are represented by gray dots. Reproduced from Reuter et al. (2016).

