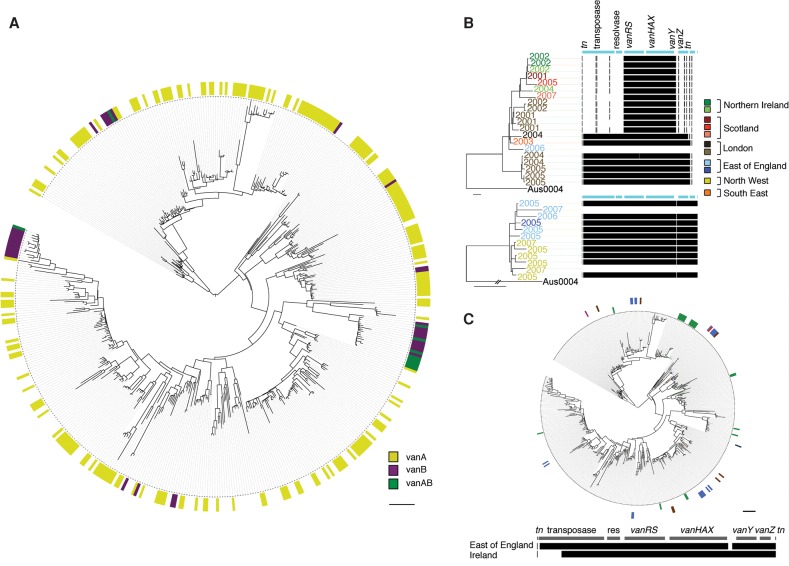
Figure 4.
Vancomycin resistance in E. faecium from the UK&I. (A) Relationship between VREfm and VSEfm. Maximum likelihood tree of 477 study isolates belonging to the clonal expansion of Clade A. Colored circle denotes presence of vanA (yellow), vanB (purple), vanA and vanB (green), or none (vancomycin susceptible, white). Scale bar, 90 SNPs. (B) Acquisition of vancomycin resistance within hospitals. Maximum likelihood trees of two clusters labeled by year of isolation and colored by hospital: genes present (black) or absent (white) from the vanA transposon. Scale bar, 27 SNPs. (C) Locally prevalent transposons. Maximum likelihood tree of national isolates belonging to the clonal expansion of Clade A. Colored circles denote isolates carrying transposons overrepresented in Ireland (inner) or the East of England (outer) colored by referral network or country (green, Ireland; blue, East of England; brown, London; navy, Yorkshire; pink, West Midlands; red, North East). (Bottom) Genetic content of the vanA transposon for both transposon types. Scale bar, 90 SNPs.

