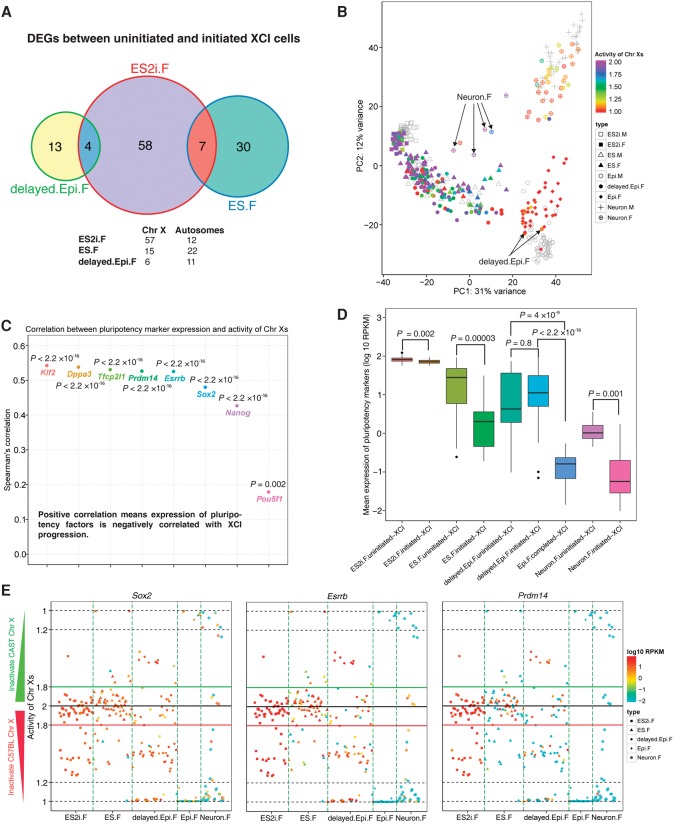
Figure 4.
Association between pluripotency, differentiation, and XCI progression across different developmental states. (A) Venn graph for DEGs between uninitiated- and initiated-XCI cells. Female cells were divided into two distinct XCI state groups: (1) uninitiated-XCI (1.8< activity of Chr Xs ≤2); and (2) initiated-XCI (1≤ activity of Chr Xs ≤1.8). Adjusted P < 0.01. (B) Each female cell is colored by the corresponding activity of Chr Xs in PCA. Male cells are shown in gray. Two delayed.Epi.F cells with completed-XCI (arrows, 1≤ activity of Chr Xs ≤1.2) clustered together with Epi.M cells. Four Neuron.F cells with uninitiated-XCI (arrows) were closer to ES cells but further away from other Neuron.F cells. (C) Spearman's correlation between expression of pluripotency genes and the activity of Chr Xs. (D) Comparison of pluripotency gene expression between cells of uninitiated- and initiated-XCI groups for each condition. Epi.F only contained cells from completed-XCI group (1≤ activity of Chr Xs ≤1.2). The y-axis represents mean expression of eight pluripotency genes (Pou5f1, Sox2, Nanog, Klf2, Esrrb, Dppa3, Tcfcp2l1, and Prdm14). Student's t-test was applied to examine the significance of the expression difference between two distinct XCI groups. (E) Overview of the activity of Chr Xs and expression of pluripotency genes for Sox2, Esrrb, and Prdm14 in each cell.

