Figure 5.
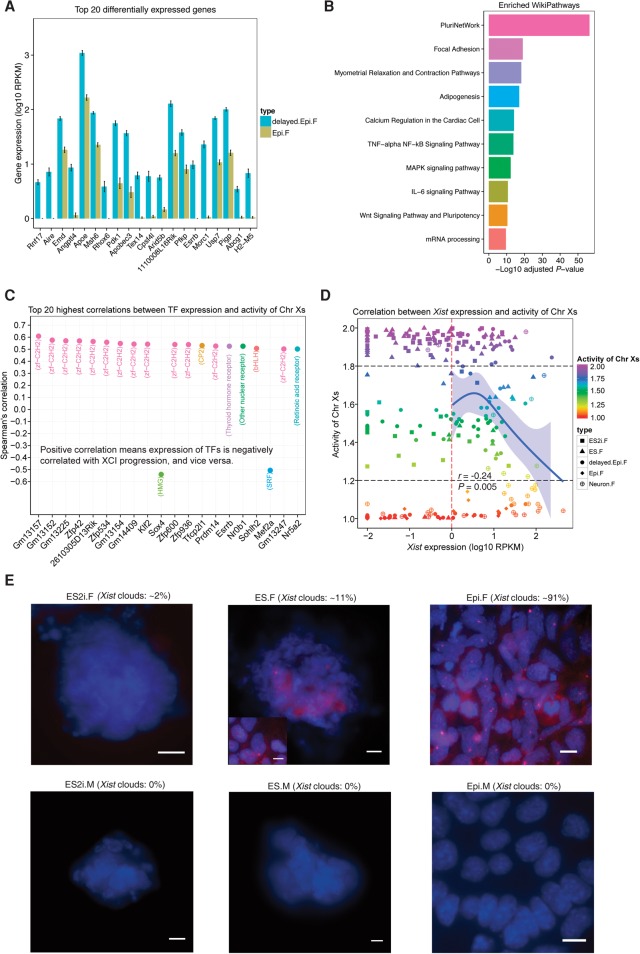
Underlying factors associated with delayed progression of mEpiSCs and heterogeneity in expression of Xist. (A) Top 20 DEGs between delayed.Epi.F and Epi.F cells (sorted by adjusted P, mean ± SEM). Cutoff: adjusted P < 0.01. (B) Top 10 significantly enriched WikiPathways for the DEGs between delayed.Epi.F and Epi.F cells. (C) Top 20 highest correlations between TF expression and the activity of Chr Xs. The family of each TF is shown in the parentheses. Spearman's correlations were with adjusted P < 0.01. (D) Spearman's correlation between Xist expression and the activity of Chr Xs. Confidence interval of 95% for the curve of Natural Spline is shown. (E) RNA FISH of Xist shown for female and male ES2i, ES, and Epi cells. Xist clouds are in red, and nuclei are in blue (DAPI staining). For ES.F cells, Xist clouds are shown in two different morphologies (colony and the metastable cells). The percentage of Xist clouds was calculated per 100 cells from multiple images (n = 6) per condition. The Xist clouds were imaged with 0.3 μm z-stack. (Scale bar) 10 μm.

