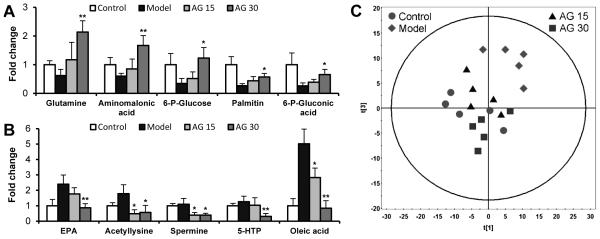
Figure 4.
Metabolomic analysis of serum samples in Week 13. (A-B) The top 10 metabolites responsible for the separation between the model and ginseng groups. (A) Top five upregulated metabolites. (B) Top five downregulated metabolites. EPA, 5,8,11,14,17-eicosapentaenoic acid; 5-HTP, 5-hydroxy-L-tryptophan; oleic acid, 9-octadecenoate. Ordinate values are peak area ratios, i.e., relative concentrations (peak area of each groups/peak area of control group) of each metabolite. (C) Metabolic profiling of serum samples. Principal components analysis (PCA) score plot showing data from different groups. Model, AOM+DSS; AG, American ginseng; AG 15, AOM+DSS+AG (15 mg/kg/day); AG 30, AOM+DSS+AG (30 mg/kg/day). *, P< 0.05 and ** P< 0.01 compared to the model group.

