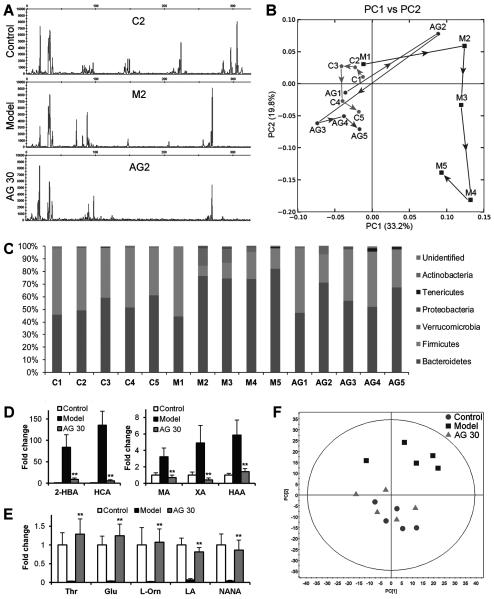
Figure 5.
Microbiota and metabolomic analyses of stool samples. (A-C) Effects of American ginseng on the structure of intestinal microbiota. (A) Representative T-RFLP chromatograms from different-sized bacterioplankton populations. (B) T-RFLP-based PCA profiles showing differences in the microbiota profile. (C) Taxonomic composition of the microbiota at the phylum level identified by high-throughput 16S rRNA gene sequencing. C, control; M, model; and AG, American ginseng 30 mg/kg/day. Number 1, 2, 3, 4 and 5 in the x-axis indicate Weeks -1, 2, 5, 8 and 13, respectively. (D-F) Metabolomic analysis of samples in Week 13. (D-E) The top 10 metabolites responsible for the separation between the model and ginseng groups. (D) Five downregulated metabolites. 2-HBA, 2-hydroxybutanoic acid; HCA, hydrocinnamic acid; MA, malic acid; XA, xanthurenic acid; HAA, hydroxyacetic acid. (E) Five upregulated metabolites. Thr, threonine; Glu, glutamate; L-Orn, L-ornithine; LA, linolenic acid; NANA, N-acetylneuraminic acid. (F) Metabolic profiling of stool samples. Principal components analysis (PCA) score plot showing data from different groups. ** P < 0.01 compared to the model group.

