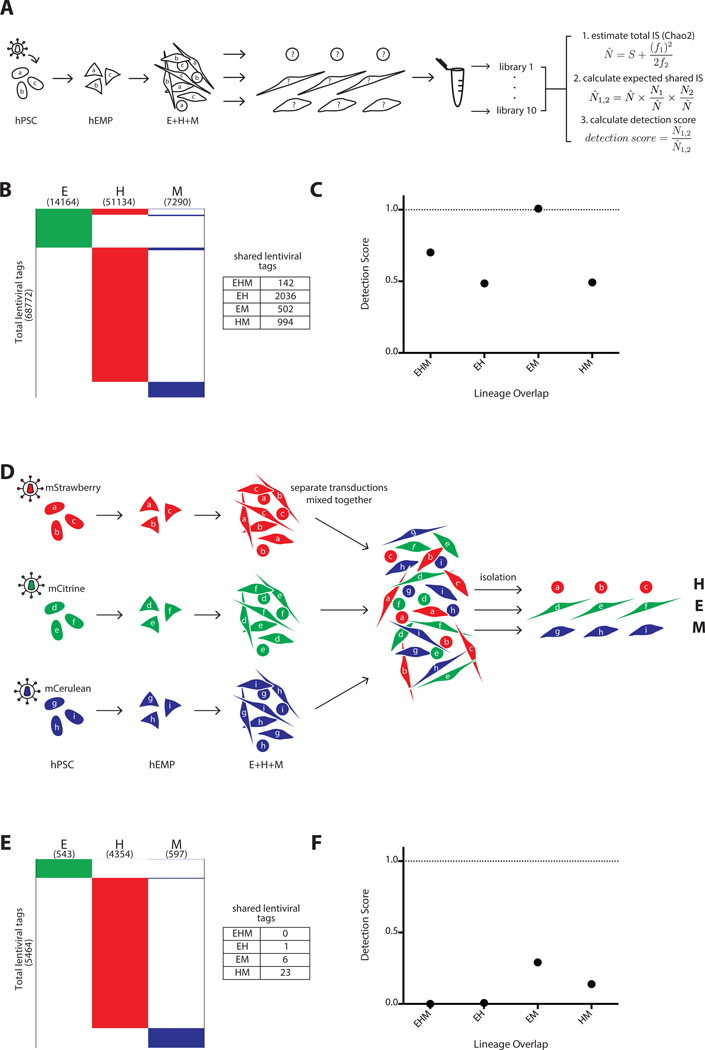
Figure 4.
Positive and negative control experiments to determine the maximal and minimal expectations for lentiviral tag sharing. (A–C) Positive control, and (D–F) negative control for clonal detection limits. (A): Schema of polyclonal hPSC tagging experiment performed to define upper boundary of detection. A pool of hPSC were transduced, expanded briefly without selection, and induced to become hEMP, which were then differentiated and analyzed via non-restrictive linear amplification-mediated PCR (nrLAM-PCR) and HTS. For each lineage, 10 separate DNA samplings were taken for nrLAM-PCR and sequencing, with each sampling labeled by a unique barcode. These data were used for Chao2 estimation of total tag count in each lineage, and this information was used in our model to calculate a shared tag “detection score” (N̂ = estimated total number of lentiviral tags, S = observed number of total tags, f1 = number of tags observed only once, f2 = number of tags observed only twice). N̂ 1,2 = expected shared tags between population 1 and 2, N1,2 = observed shared tags between population 1 and 2 (see also Supporting Information Figs. 3, 4 and Methods for Chao2 explanation and model). (B): Lentiviral tags identified in each lineage derived from a polyclonal pool of transduced hPSC. A total of 68,772 tags were detected in one or more lineage. Each horizontal line in the schematic heatmap represents a specific lentiviral tag and tags are clustered based on their presence in lineages; tags identified in two or more lineages are shown in the same horizontal position. The total number of tags sequenced from each lineage is listed in parentheses below the lineage label. 142 tags were shared among all three lineages. 2036, 502 and 994 shared tags were found between EH, EM, and HM, respectively. The majority of tags (65,098) were detected in only one lineage, illustrating the compounded effect of sampling during cell harvest and sequencing preparation. (C): The numbers of expected shared tags were compared to the observed shared tags in the form of a detection score (observed/expected). The detection score for EHM, EH, EM, and HM were 0.7, 0.5, 1.0, and 0.5, respectively. Since hPSC are assumed to be pluripotent, the detection score between any set of lineages represents the maximum tag sharing one can detect in this experimental system. (D): Three separate pools of hPSCs were transduced with lentiviral vectors expressing distinct fluorescent markers and differentiated in parallel on OP9. The three pools of differentiated cells were combined, and each lineage was then isolated from this pool based on the sets of lineage markers (Fig. 1A), each of which was paired with a distinct fluorescent marker (mStrawberry hematopoietic; mCitrine endothelium; mCerulean mesenchyme). This negative control served to determine the frequency of false clonal overlap by chance and sorting errors. (E): Only 1, 6 and 23 shared tags were found between EH, EM, and HM, respectively and no tags were shared with all lineages (EHM). (F): The detection score for EHM, EH, EM, and HM were 0, 0.007, 0.3, and 0.1, respectively. These scores represent the false positive rate of tag sharing in this experimental system. Abbreviations: hEMP, human embryonic mesoderm progenitor; hPSC, human pluripotent stem cell.

