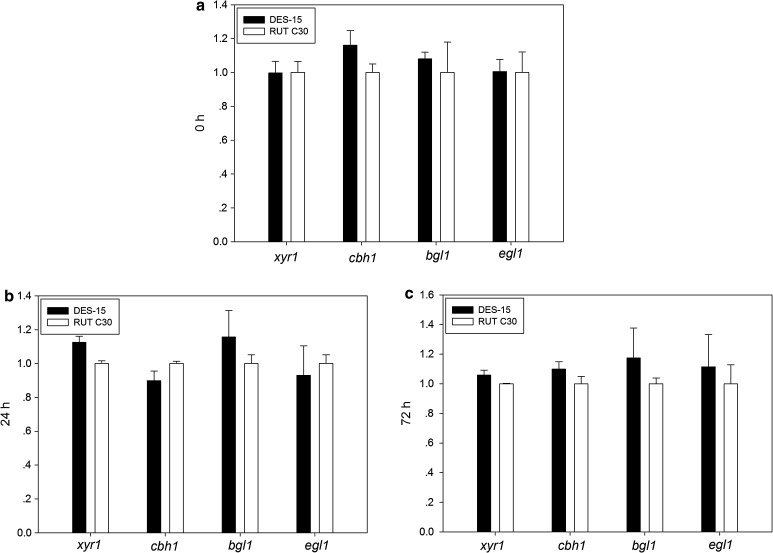
Fig. 3.
Expression levels of xyr1, cbh1, bgl1, and egl1 in RUT C30 and DES-15 at 0 (before batch), 24, and 72 h (a–c). The gpd1 gene was used for normalization, and the values were calculated by 2−ΔΔCt methods. Experiments were performed in three independent replicates. Error bars represent the standard deviations. Asterisks were indicated significant differences at P < 0.05 according to Student’s t tests

