
Fig. 2.
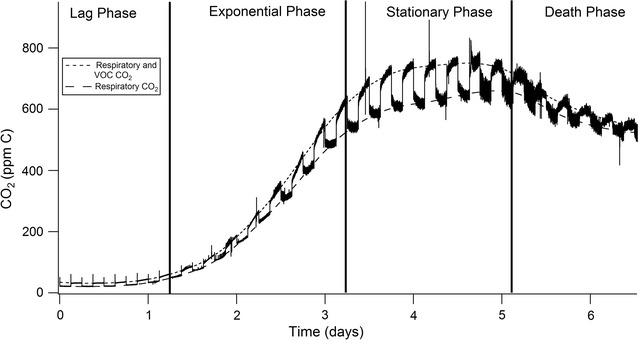
A representative CO2 profile of a fungal solid state reactor experiment after correcting for dilution. The lower line represents respiratory CO2 as indicated by the interpolated dashed line and the upper line is the sum of respiratory and oxidized VOC CO2 as represented by the interpolated dotted line. Values switch between respiratory CO2 and CO2 from both fungal metabolism and VOCs every 3 h. The graph is split into growth phases based on the shape of the respiratory CO2 curve