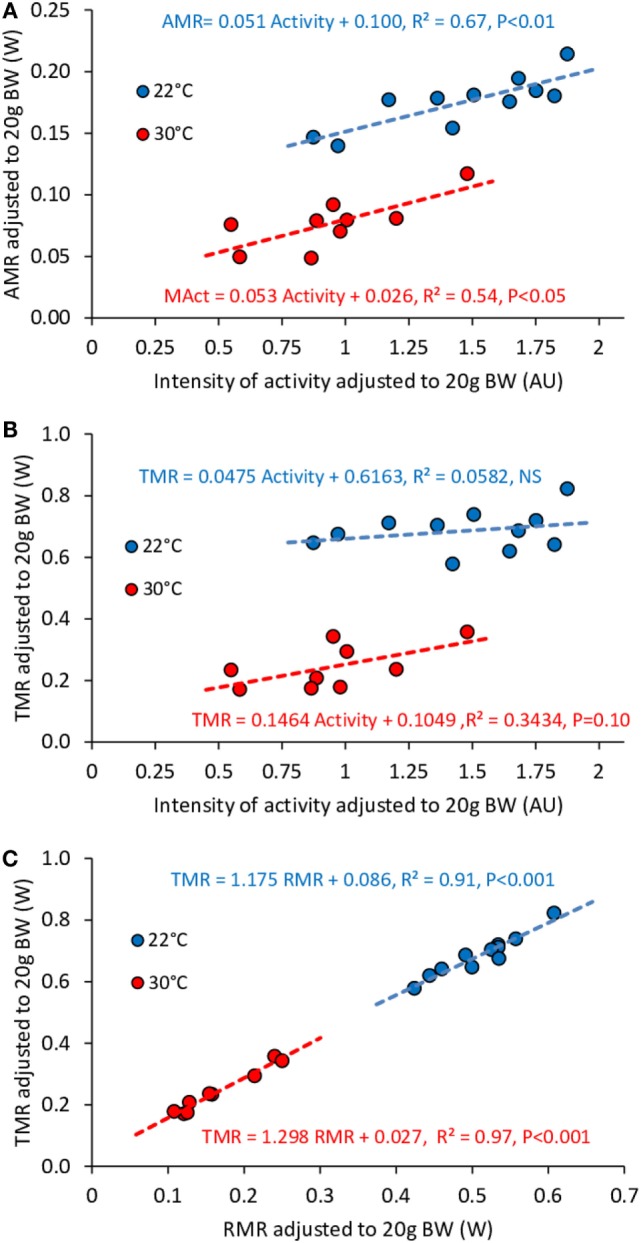
Figure 7.

Correlation between AMR and activity (A), TMR and activity (B), TMR and RMR (C) in ad libitum fed mice housed at 30°C (n = 9) and 22°C (n = 11). Data are adjusted to 20 g BW. Despite the fact that intensity of activity affects significantly AMR, the consequences on TMR are not significant. The strongest predictor of TMR appears to be RMR.
