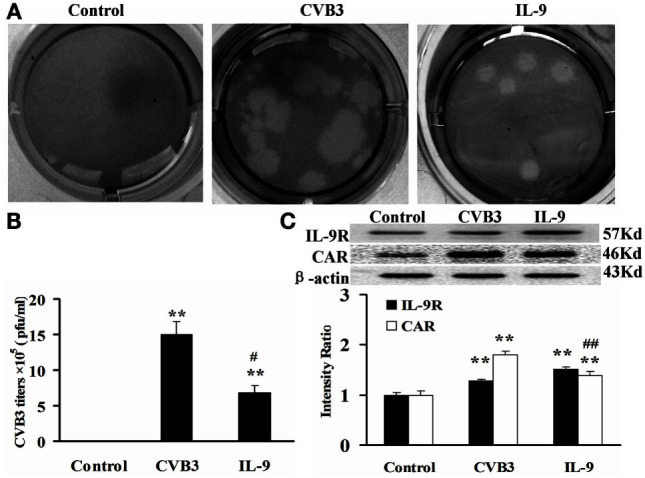
Figure 5.

IL-9 directly suppressed CVB3 replication in cardiomyocyte in vitro. (A) Representative pictures of plaque assay of CVB3 in different groups. (B) The results of statistical analysis for CVB3 titers in Control, CVB3, and IL-9 groups. (C) The changes of IL-9R and CAR on myocardial cells in different groups. **P < 0.01 vs. control group; #P < 0.05 vs. CVB3 group; ##P < 0.01 vs. CVB3 group. Values are means ± SEM. Each experiment was independently performed three times.
