
Figure 4.
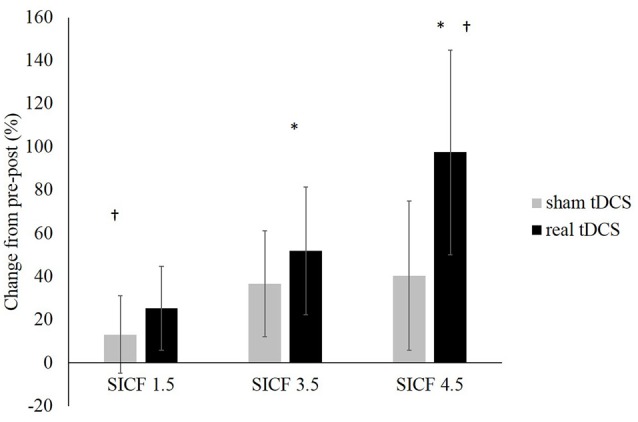
Change in SICF MEP amplitudes (as a percentage of unconditioned MEPs) at ISIs of 1.5, 3.5 and 4.5 ms (all P > 0.05). *Denotes significant difference between SICF 3.5 and 4.5. †Denotes significant difference between SICF 1.5 and 4.5.
Official websites use .gov
A
.gov website belongs to an official
government organization in the United States.
Secure .gov websites use HTTPS
A lock (
) or https:// means you've safely
connected to the .gov website. Share sensitive
information only on official, secure websites.
Change in SICF MEP amplitudes (as a percentage of unconditioned MEPs) at ISIs of 1.5, 3.5 and 4.5 ms (all P > 0.05). *Denotes significant difference between SICF 3.5 and 4.5. †Denotes significant difference between SICF 1.5 and 4.5.