Figure 6.

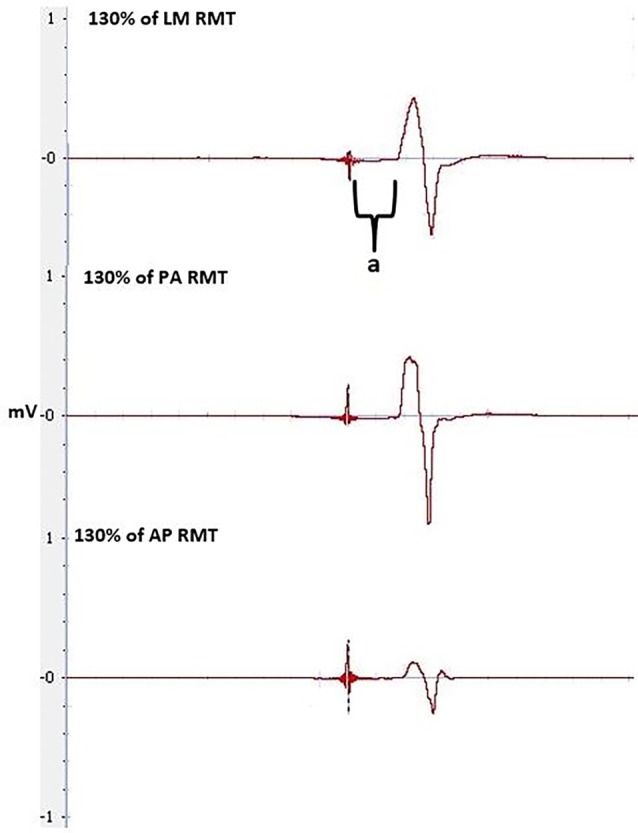
MEPs at 130% of RMT at LM, PA and AP orientation, pre-tDCS, used to calculate latencies and latency difference. Latency is between the stimulus to the onset of the MEP, indicated by a.

MEPs at 130% of RMT at LM, PA and AP orientation, pre-tDCS, used to calculate latencies and latency difference. Latency is between the stimulus to the onset of the MEP, indicated by a.