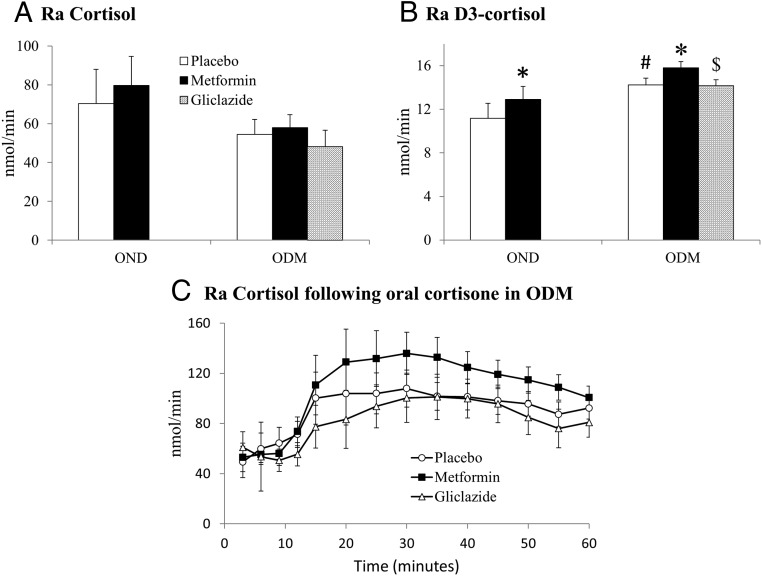
Figure 2.
The effect of metformin on 11βHSD1 activity in vivo. Data are expressed as mean ± SEM for the effect of metformin (black columns), gliclazide (bricked columns), and placebo (white columns) on the Ra of cortisol (A) and D3-cortisol (B) during steady state. C, The effect of metformin (black squares), gliclazide (open triangles), and placebo (open circles) on Ra cortisol after 5 mg oral cortisone ingestion in the ODM group. Phases were compared using paired t tests in the OND group and repeated measures ANOVA with post hoc Fisher's LSD testing in the ODM group. Placebo-phase data in OND and ODM groups were compared using the unpaired t test. *, P < .05 vs placebo; $, P < .05 vs metformin; #, P < .05 vs OND group.

