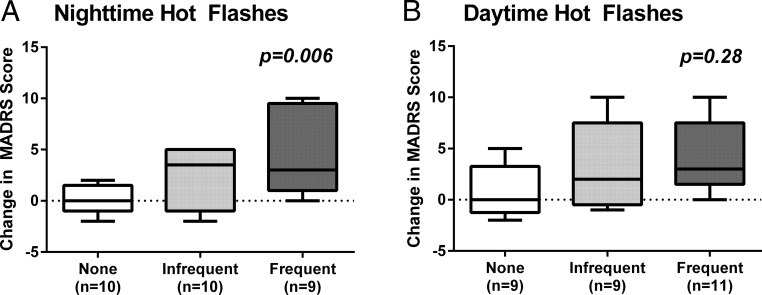
Figure 1.
Box plots showing the increase in depressive symptoms from before to after GnRHa treatment as measured by within-subject change in MADRS score in relation to the number of subjectively reported nighttime (A) and daytime (B) HFs. Box plots show the distribution of the data within each group from the 25th to 75th percentile, with the median line and the whiskers representing the winsorized extreme values. Data are presented by HF frequency groupings for visual purposes using a median split to define those with more or less frequent symptoms at night and those with none (< five HFs during the entire follow-up period). P values reflect results from univariate linear regression models.

