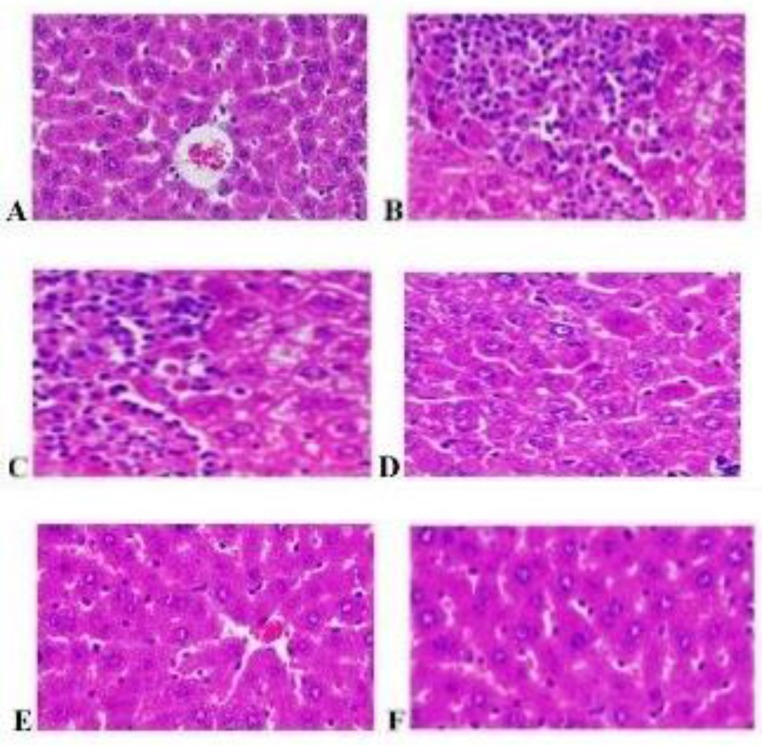
Figure 1.
Effect of various treatments on histology of liver tissue
A: Normal control; B: High-fat diet; C: High-fat diet with petroleum ether extract of H. indicus 200 mg/ kg bw; D: High-fat diet with ethyl acetate extract of H. indicus 200 mg/kg bw; E: High-fat diet with methanolic extract of H. indicus 200 mg/kg bw; F: High-fat diet with standard drug of atorvastatin (1.2 mg/kg bw)

