Figure 8.

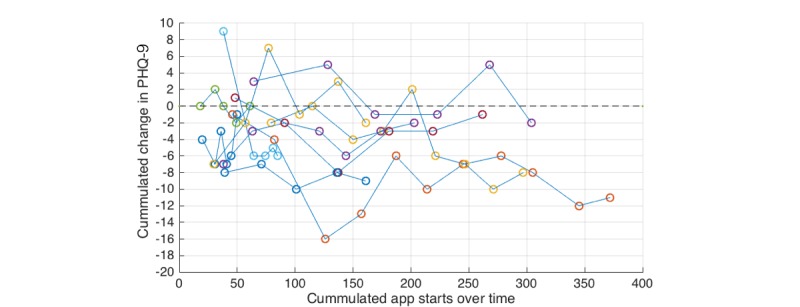
Scatter plot of cumulated app starts per subject over time and cumulated change in PHQ-9 values. Note: The development of PHQ-9 scores of individual subjects is indicated by connected points of the same color.

Scatter plot of cumulated app starts per subject over time and cumulated change in PHQ-9 values. Note: The development of PHQ-9 scores of individual subjects is indicated by connected points of the same color.