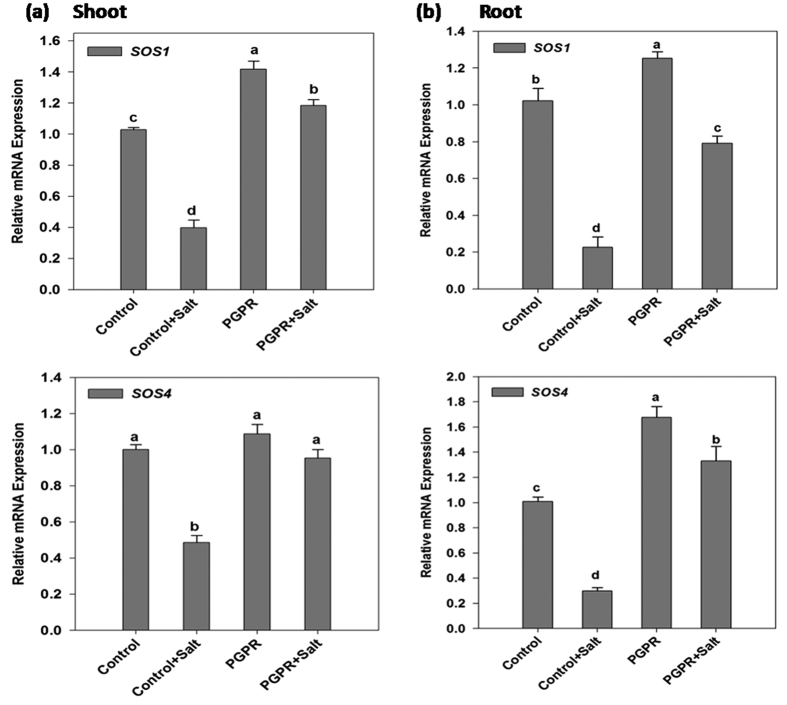
Figure 4. Real time expression analysis of SOS pathway genes viz., SOS1 and SOS4 in shoot and root of PGPR-inoculated wheat plants subjected to salt stress.
The expression analysis of SOS1 and SOS4 transcript in (a) shoot and (b) root of PGPR Dietzia natronolimnaea STR1 inoculated 12 d old wheat plants under both non-saline and saline conditions. Un-inoculated wheat plants grown in non-saline condition were used as a control. The data represented means of triplicate biological and experimental repeats; error bars represented SEM. Different letters indicate statistically significant differences between treatments (Duncan’s multiple range test P < 0.05).

