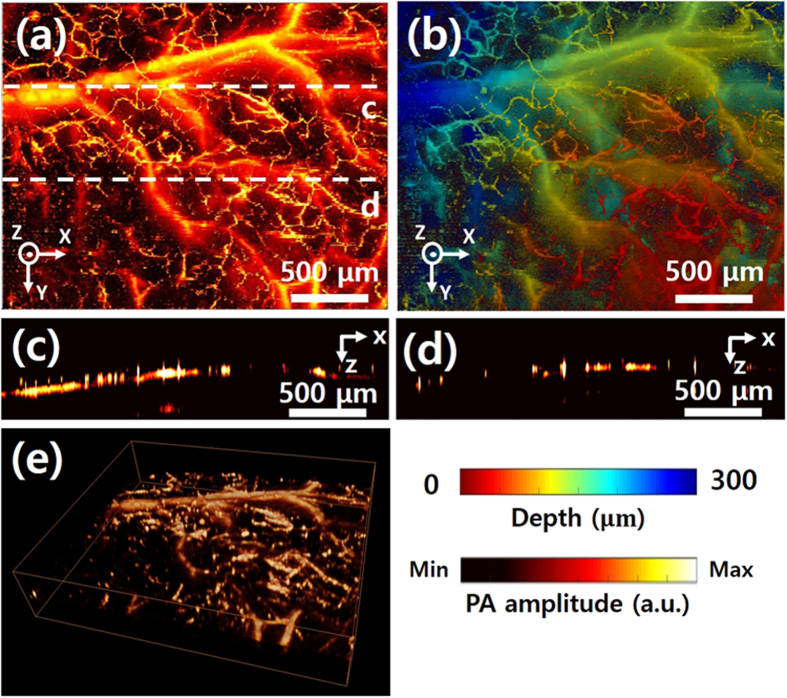
Figure 5. In vivo PA imaging of GM-OR-PAM in NCL of a mouse ear.
(a) PA MAP image of microvasculatures of mouse ear. (b) Depth-encoded PA MAP image corresponding to (a). (c,d) B-scan cross sectional PA images of mouse ear along the white dashed lines in (a). (e) 3D PA volumetric image (Supplementary Video S3).

