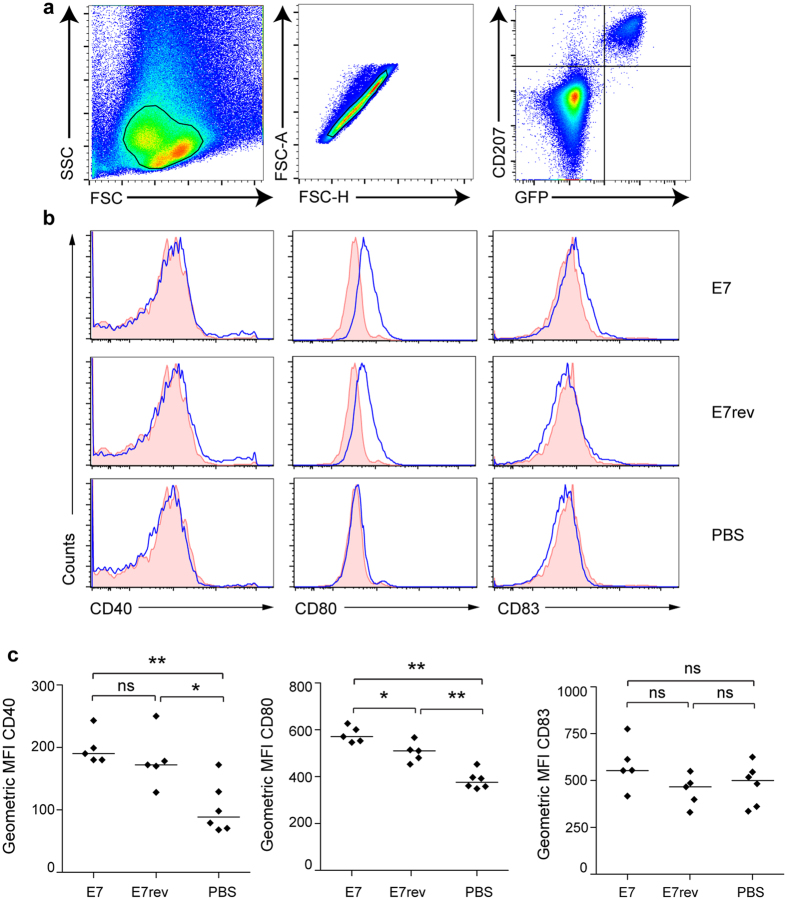
Figure 2. Co-stimulatory marker expression on LC from K14 E7 expressing mouse skin is increased.
Lang-DTR mice were injected i.d. beneath the ear skin with 5 × 10⁶ K14 E7 Luc or K14 E7rev Luc lentivirus particles, or with PBS. Ten days following transduction, epidermal ear suspensions were prepared and analyzed by flow cytometry. (a) The gating strategy applied to identify the single, CD207, GFP positive cells that were analysed for co-stimulatory molecule expression. (b) Surface expression of CD40, CD80, and CD83 on LC was analyzed. Representative histograms are shown for a minimum of 5 mice in each group. The shaded histograms correspond to isotype control staining. (c) The geometric mean fluorescence intensity (MFI) of CD40, CD80, and CD83. Lines show the median for at least 5 mice per group. *P < 0.05; **P < 0.01 (Mann-Whitney U).

