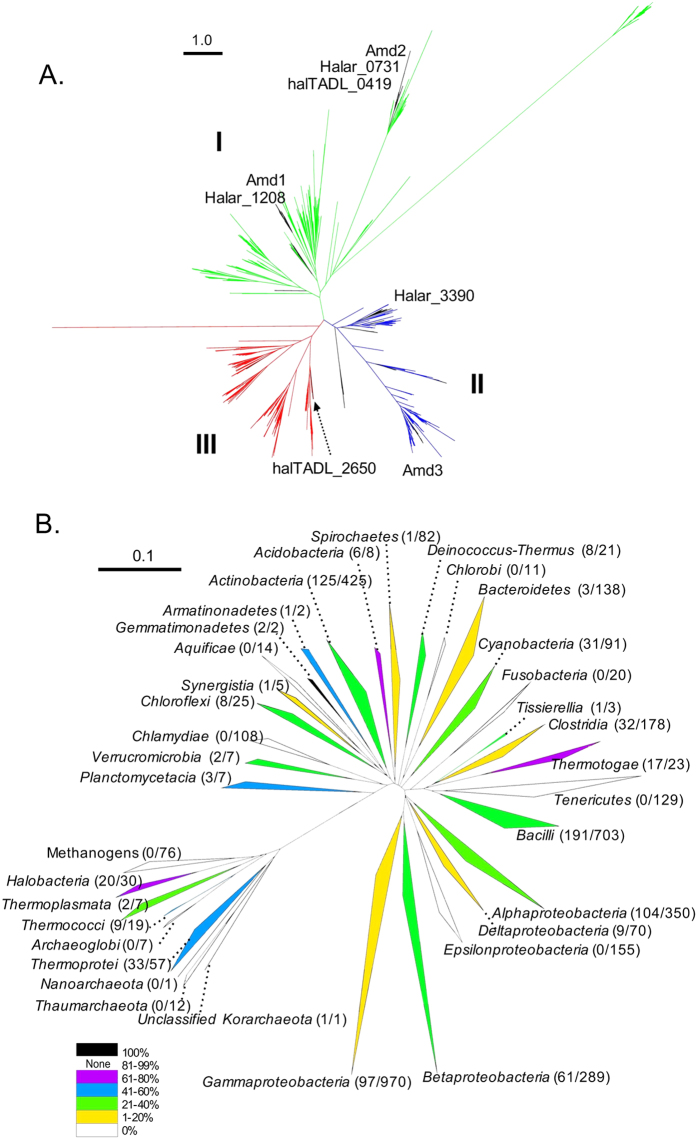
Figure 6. Diversity distribution and abundance of Amd/Fmd sequences within Archaea and Bacteria.
(A) Maximum likelihood tree of Amd/Fmd protein sequence clusters (OTU0.9) showing three distinct clades (Clade 1, green; Clade II, blue; Clade III, red) with the root of the tree (bootstrap value, 0.996) being of bacterial origin. Clusters of archaeal sequences are highlighted (black branches). The Deep Lake haloarchaeal Amd/Fmd sequences (Hrr. lacusprofundi: Amd1, Amd2, Amd3; undescribed genus DL31: Halar_0730, Halar_1208, Halar_3390; Hht. litchfeldiae: halTADL_0419, halTADL_2650) were distributed in Clade I (Amd1, Halar_1208, Amd2, Halar_0731 and haltADL_0419), Clade II (Amd3 and Halar_3390) and Clade III (haltADL_2650). Scale bar represents 1 amino acid variation per aligned position. (B) Neighbour-joining tree of 16S rRNA gene sequences for closed genomes from Archaea and Bacteria which possess Amd/Fmd sequences. 16S rRNA gene sequences represented at class or phylum level. Clades are colored according to the proportion of closed genomes that contain Amd/Fmd sequences. The number of Amd/Fmd sequences relative to total number of closed genomes in a clade is shown in parentheses after the name of the clade. Bacterial clades with less than 10 sequences that do not contain Amd/Fmd sequences are not displayed. The scale bar represents 0.1 changes per base position.

