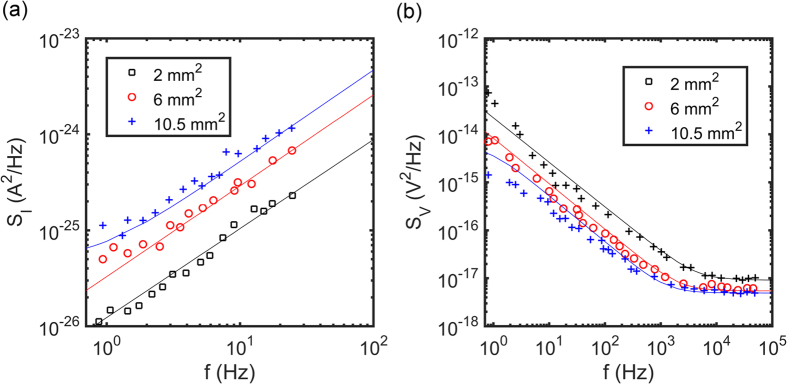
Figure 4.
(a) The power spectral density of current noise, SI, as a function of frequency. (b) The power spectral density of voltage noise, SV, as a function of frequency. The noise was measured unbiased. The noise spectra are averages over 20 consecutive measurements. Different symbols indicate different electrode areas. The measurements were performed in 100 mM aqueous KCl solution. The solid lines are calculated from the measured impedance using Eqs [8 and 9].

