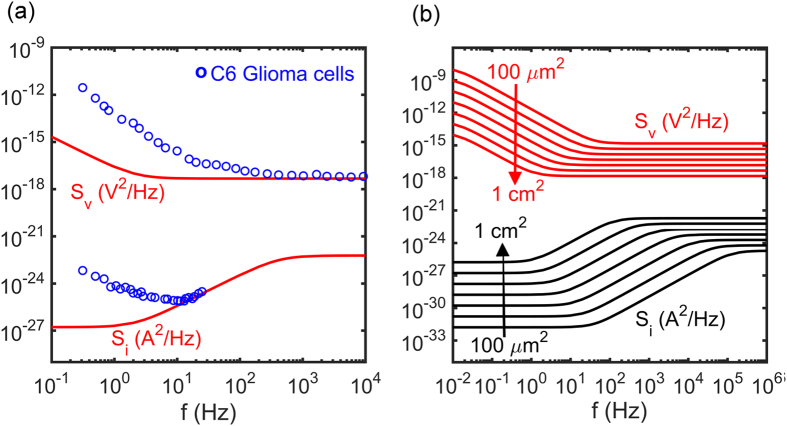
Figure 6.
(a) The power spectral density of current noise, SI, and voltage noise, SV, as a function of frequency of a population of C6 glioma cells. The power spectral densities are averages over 20 consecutive unbiased measurements, of 60 s each. The electrode area was 10.5 mm2. The solid lines are the calculated benchmark noise spectra of the bare Au electrodes in 100 mM aqueous KCl solution, reproduced from Fig. 5. (b) Calculated benchmark current and voltage noise for Au electrode/electrolyte interfaces as a function of electrode area varied by a factor of 10 from 100 μm2 to 1 cm2. The noise is calculated from Eqs [8 and 9], assuming n equal to 1, perfect scaling with area and using fixed values of the surface charge transfer resistance, 106 Ωcm2, the specific conductivity of the electrolyte, 200 Ωcm and a capacitance per unit area, 14 μC/cm2.

