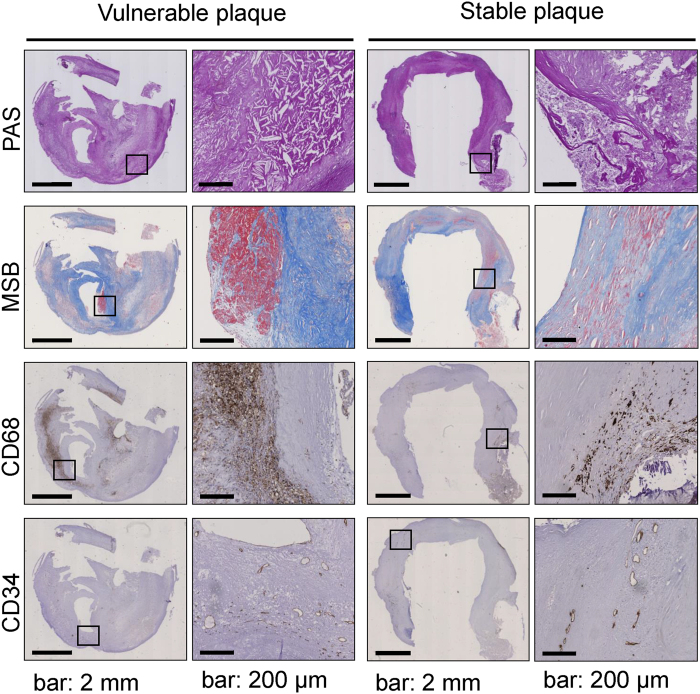
Figure 1. Plaque morphology.
Representative photomicrographs of a vulnerable plaque (A,C,E,G) and a stable plaque (B,D,F,H). Images show narrowed lumen (PAS staining) (A,B) and cholesterol clefts. Fibrous cap and connective tissue was visualized with MSB staining (blue) (C,D). Fibrin, indicating an intraplaque hemorrhage, is stained red. Inflammatory cells, identified by positive CD68 staining are shown in panels (E,F). Intraplaque microvessels were characterized by positive CD34 staining (G,H). Scalebar 2 mm in overview photomicrographs and 200 μm in detailed pictures.

